
SEO Reporting: Components, Structure, Process, Frequency & Automation

SEO reporting is the process of collecting, organizing, interpreting, and communicating organic-search performance data so stakeholders can understand results and decide what to do next. It connects search visibility, website performance, SEO activity, and business outcomes into a clear explanation of what changed and what deserves attention.
An SEO report is more than a ranking export or dashboard screenshot. Rankings, impressions, clicks, traffic, backlinks, technical issues, and conversions provide different pieces of information. Reporting brings those signals together and explains their relevance to the website’s objectives.
For example, a report showing that organic clicks increased by 20% provides only part of the picture. Stakeholders also need to know which pages or topics produced that growth, whether the additional traffic generated leads or sales, what SEO work occurred during the period, and whether the improvement appears sustainable.
Useful SEO reporting commonly covers:
- Organic search visibility
- Search traffic
- Keyword performance
- Landing-page performance
- Conversions and revenue where available
- Technical SEO health
- Backlinks and authority
- Content and on-page activity
- Competitor context where relevant
- Completed SEO work
- Risks and opportunities
- Recommended next actions
The importance of each area depends on the SEO objective. An ecommerce report can emphasize organic revenue and product-category performance, while a B2B report can focus more heavily on qualified leads, commercial landing pages, and non-branded search visibility.
SEO reports also distinguish early search indicators from business outcomes. Impressions and rankings show whether visibility is developing. Clicks and organic sessions show whether that visibility generates visits. Leads, purchases, sign-ups, and revenue show whether those visits contribute to business objectives.
Reporting does not prove that every performance change was caused by a specific SEO action. Search demand, competitors, seasonality, algorithm changes, SERP features, technical conditions, and other factors can influence results. Strong reporting separates confirmed evidence from reasonable interpretation.
A report becomes useful when it helps the reader understand what happened, why it matters, and what decision follows.
What Should an SEO Report Include?
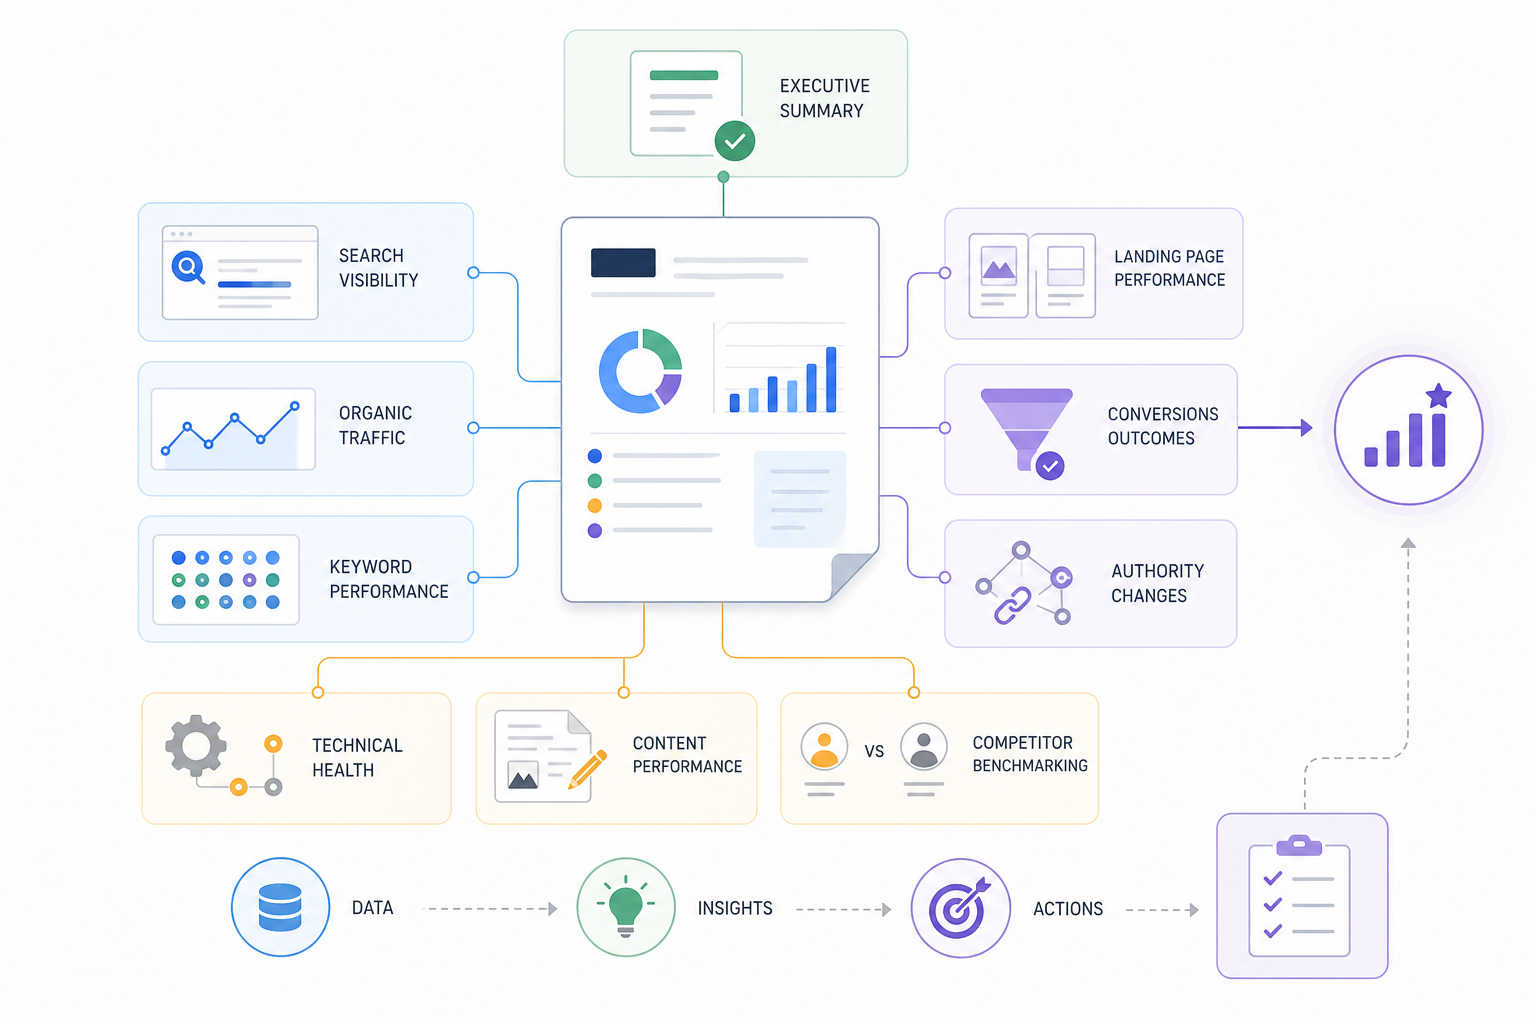
An SEO report should summarize organic-search performance, show meaningful changes in visibility and traffic, connect SEO activity with business outcomes, identify important issues, and define the next priorities.
The report does not need every metric available in an SEO platform. It needs the information required to explain performance clearly.
Executive Summary
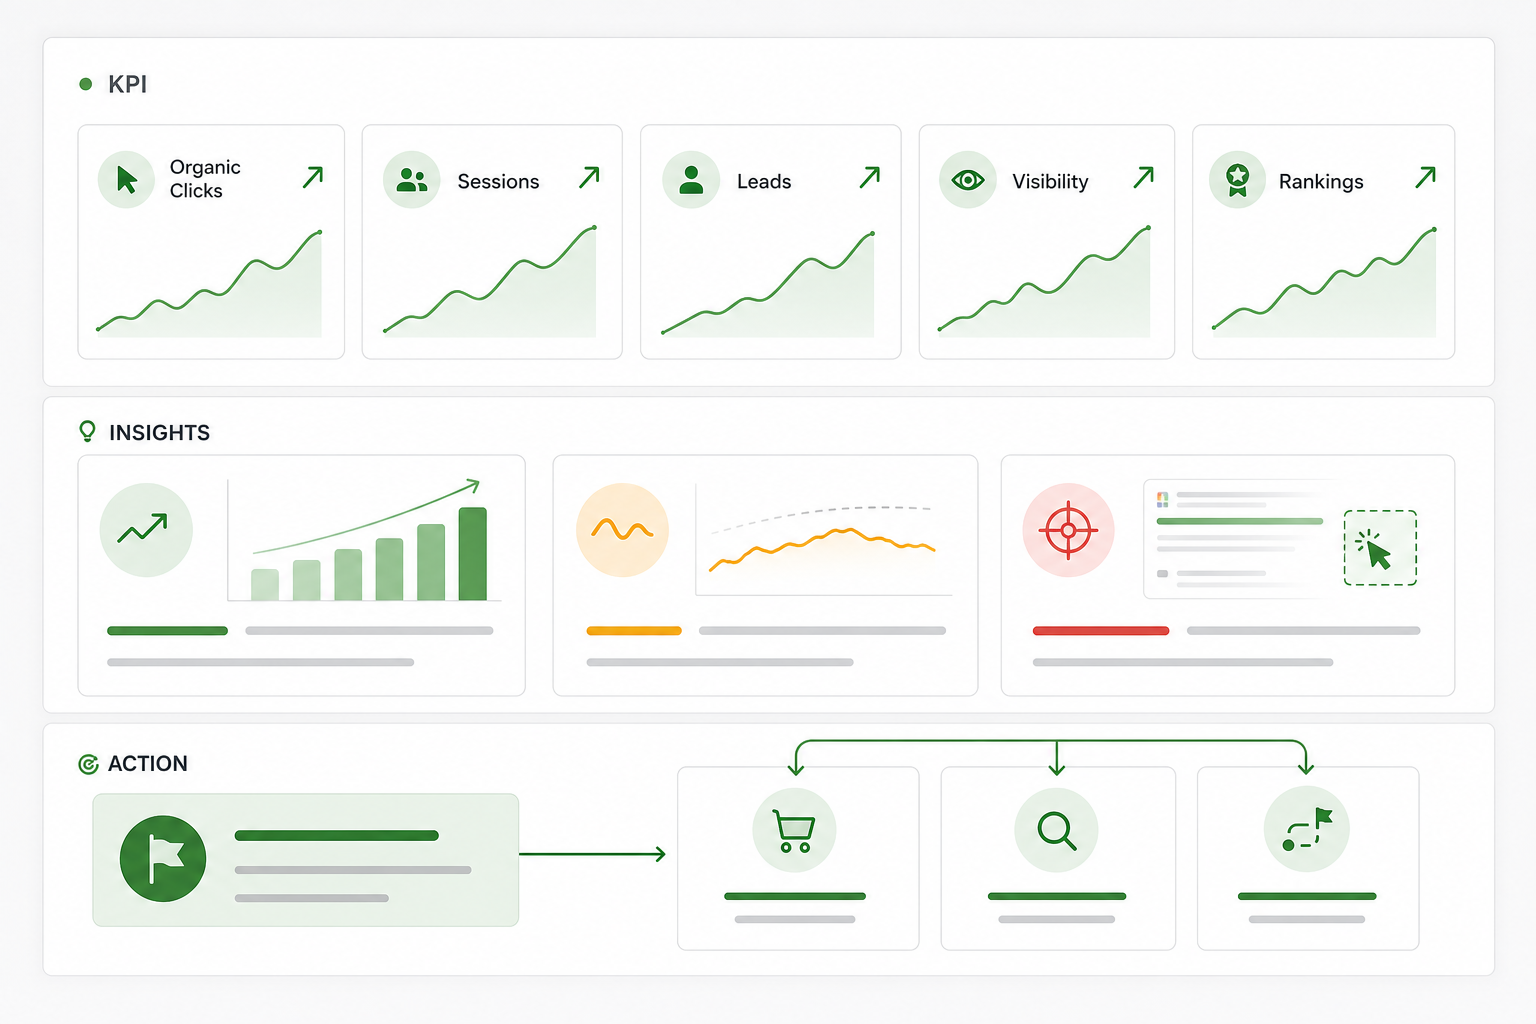
The executive summary gives stakeholders the most important conclusions without requiring them to read the complete report.
Include:
- Major performance gains
- Important declines
- Business outcomes
- Significant risks
- Key opportunities
- Immediate priorities
Keep the summary concise and decision-focused.
A useful executive summary can state that non-branded clicks increased, commercial landing pages generated more leads, one important content section declined, and the next priority is improving pages that have strong impressions but weak CTR.
Organic Search Visibility
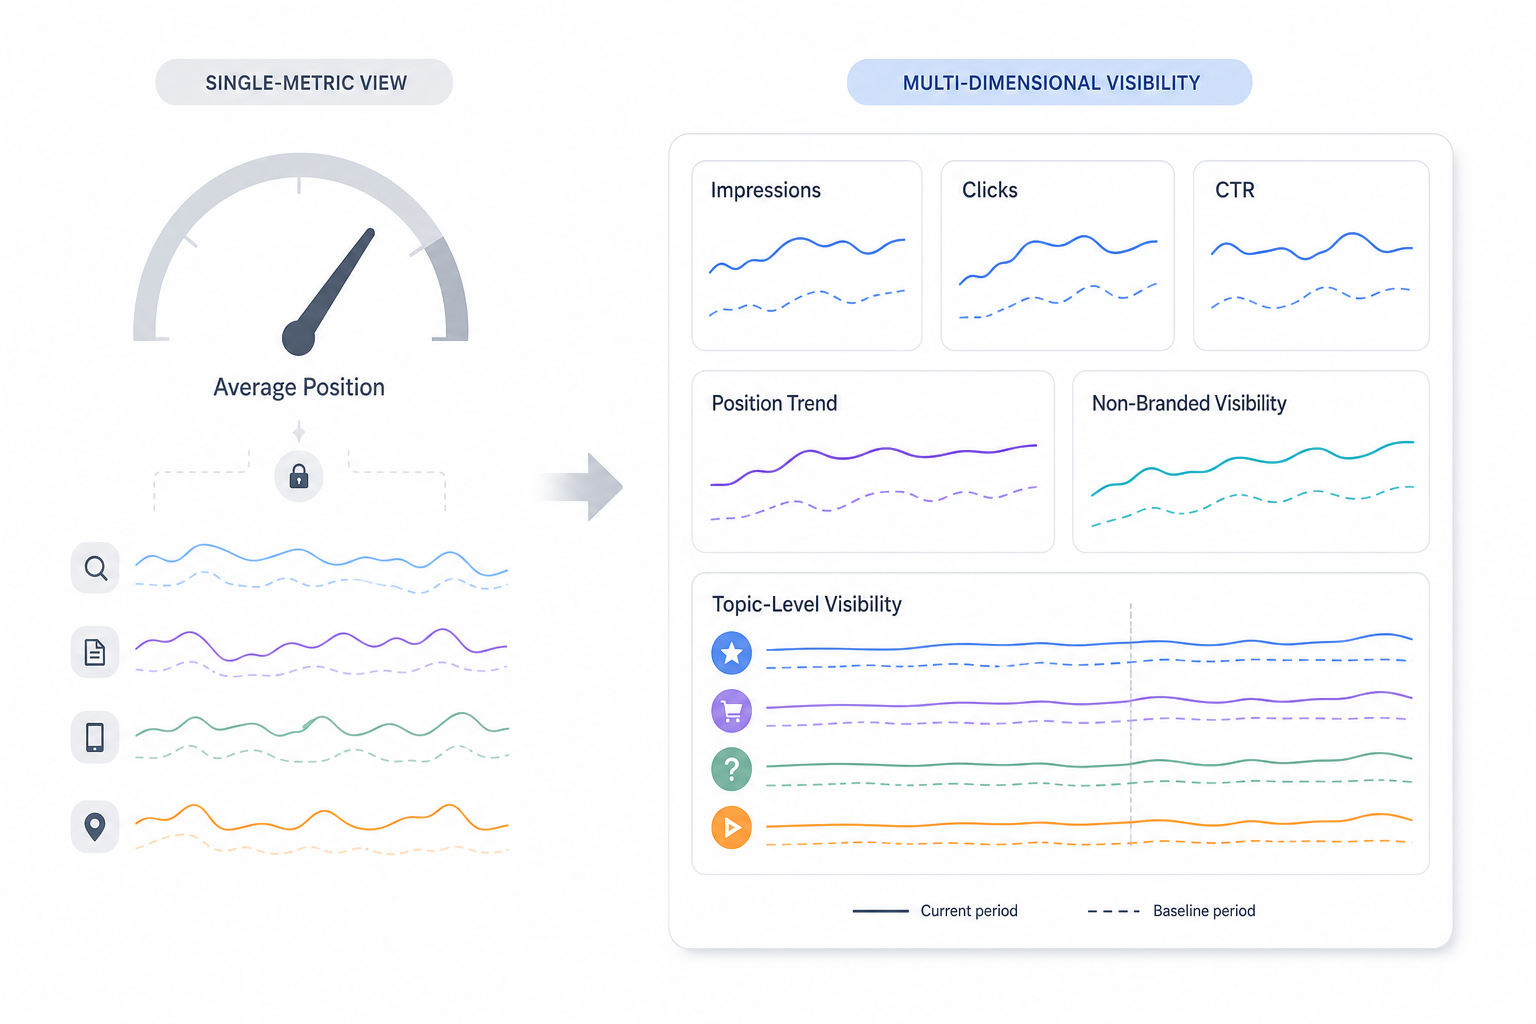
Report how the website appears in search results.
Useful metrics include:
- Impressions
- Clicks
- CTR
- Relevant position trends
- Non-branded visibility
- Topic-level visibility
Compare the current period with a meaningful baseline.
Avoid using average position as the only measure of SEO performance because one aggregated number can hide major differences between queries, pages, topics, devices, or locations.
Organic Traffic
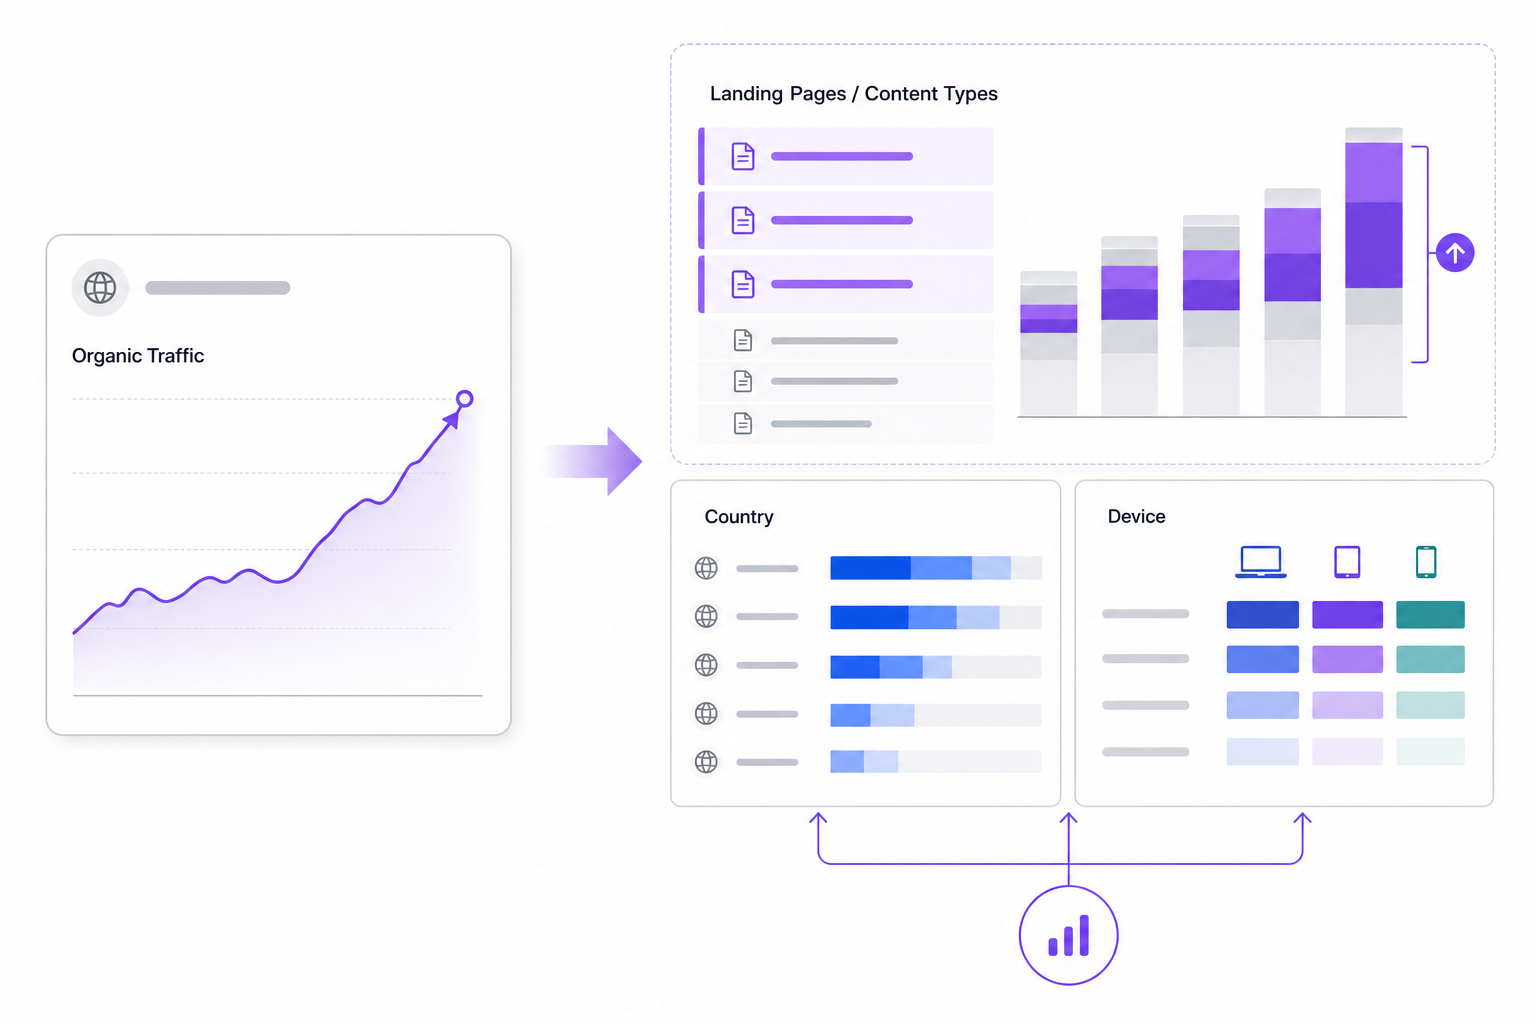
Report traffic coming from organic search.
Depending on the website, include:
- Organic sessions
- Organic users
- Landing-page traffic
- New users
- Traffic by content type
- Traffic by country
- Traffic by device
Segmentation helps explain where changes occurred.
A 15% sitewide traffic increase becomes more useful when the report shows that most of the growth came from three newly strengthened commercial pages.
Keyword Performance
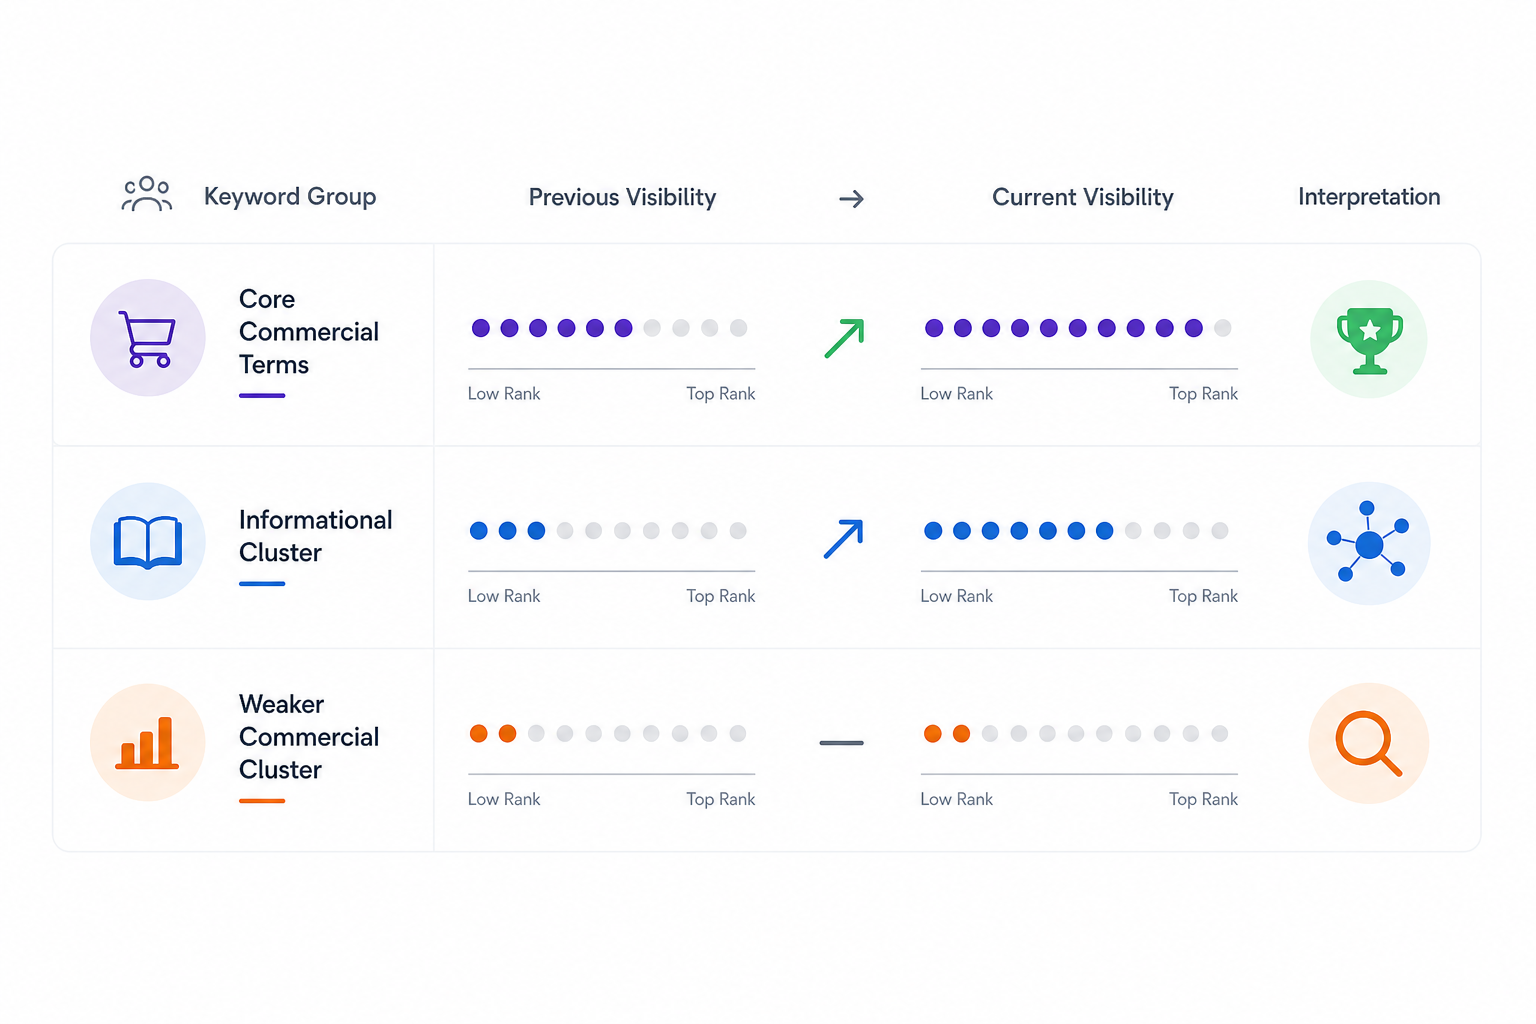
Focus on strategically meaningful keywords rather than hundreds of isolated ranking movements.
Report:
- Priority keyword groups
- Top 3 rankings
- Top 10 rankings
- Important gains
- Important losses
- Branded and non-branded visibility where relevant
- Topic-cluster visibility
- Search-volume context where useful
Keyword reporting should support a business or SEO question.
A ranking increase for an irrelevant informational keyword has less value than movement for a commercially relevant query connected with qualified demand.
Landing-Page Performance
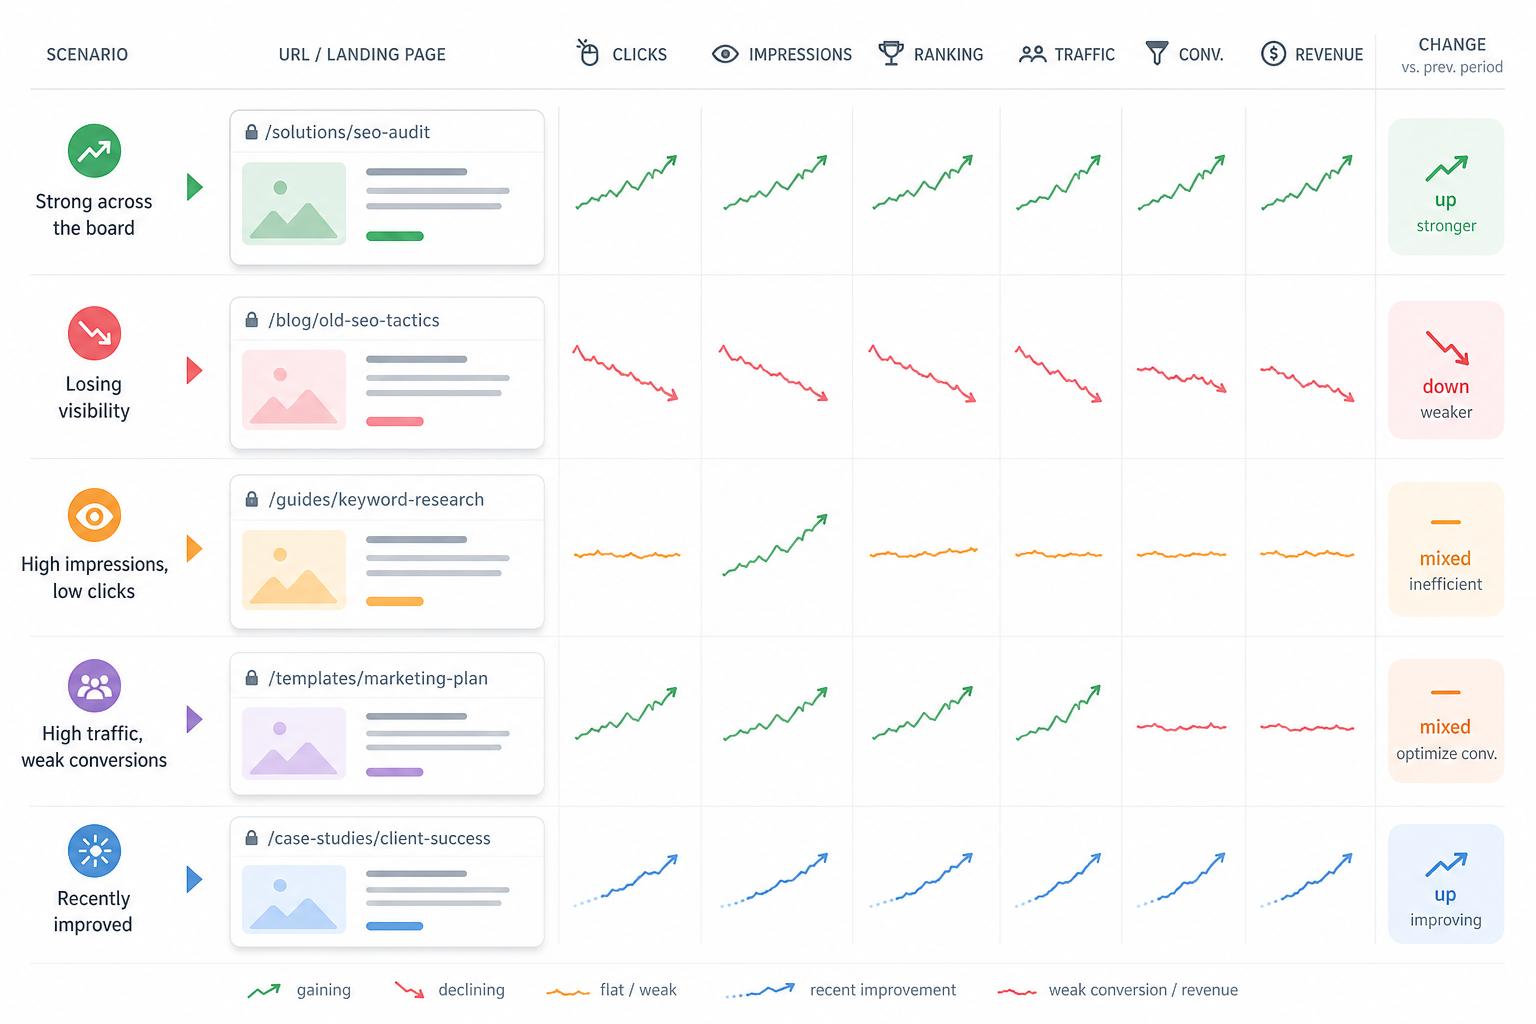
Page-level reporting explains which URLs are responsible for gains or losses.
Review:
- Clicks
- Impressions
- Organic traffic
- Rankings
- Conversions
- Revenue where available
- Traffic contribution
- Period-over-period change
This section can identify:
- Pages driving growth
- Pages losing visibility
- Pages gaining impressions without clicks
- High-traffic pages with weak conversions
- Pages improved during the reporting period
Page-level evidence makes aggregate SEO changes easier to diagnose.
Conversions and Business Outcomes
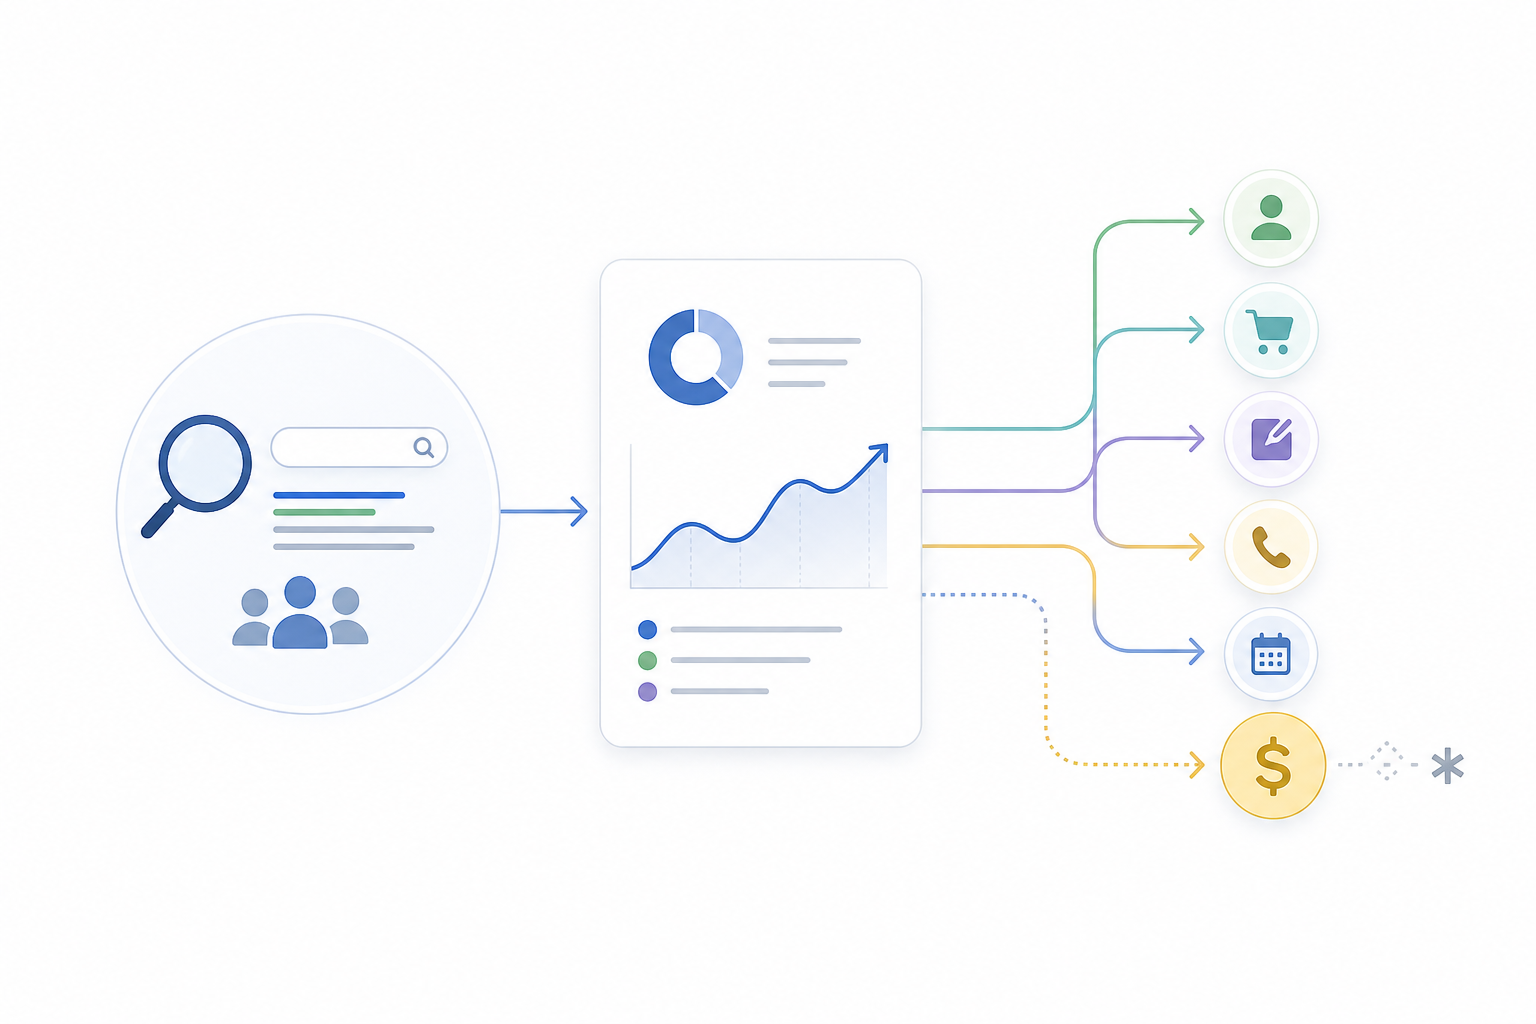
SEO reporting becomes more useful when organic performance is connected with business value.
Depending on available tracking, report:
- Leads
- Purchases
- Sign-ups
- Demo requests
- Qualified enquiries
- Phone calls
- Bookings
- Revenue
- Other relevant conversions
Avoid claiming precise ROI when revenue attribution or conversion tracking is incomplete.
A report can still explain directional contribution while clearly stating the limits of available data.
Backlink and Authority Changes
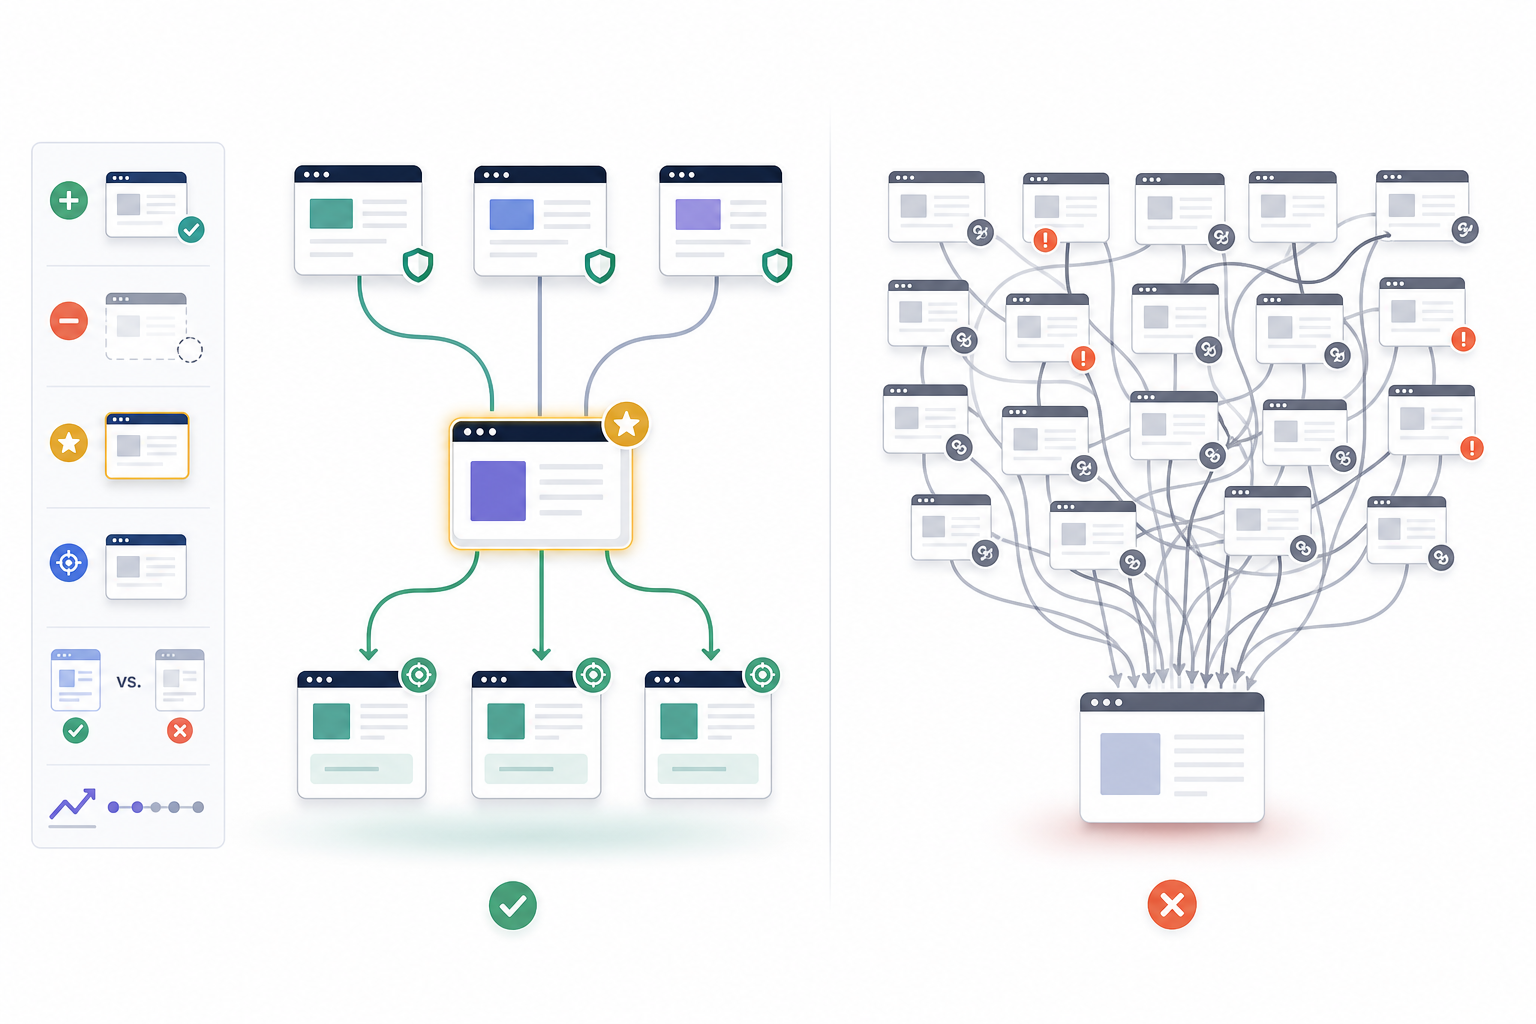
Report meaningful changes in external authority where backlinks form part of the SEO strategy.
Include:
- Important new referring domains
- Meaningful lost referring domains
- High-value backlinks
- Links to strategic pages
- Relevant competitor link gaps
- Link acquisition activity
Avoid using total backlink count alone.
A smaller number of relevant editorial links can matter more than thousands of low-quality links.
Technical SEO Health
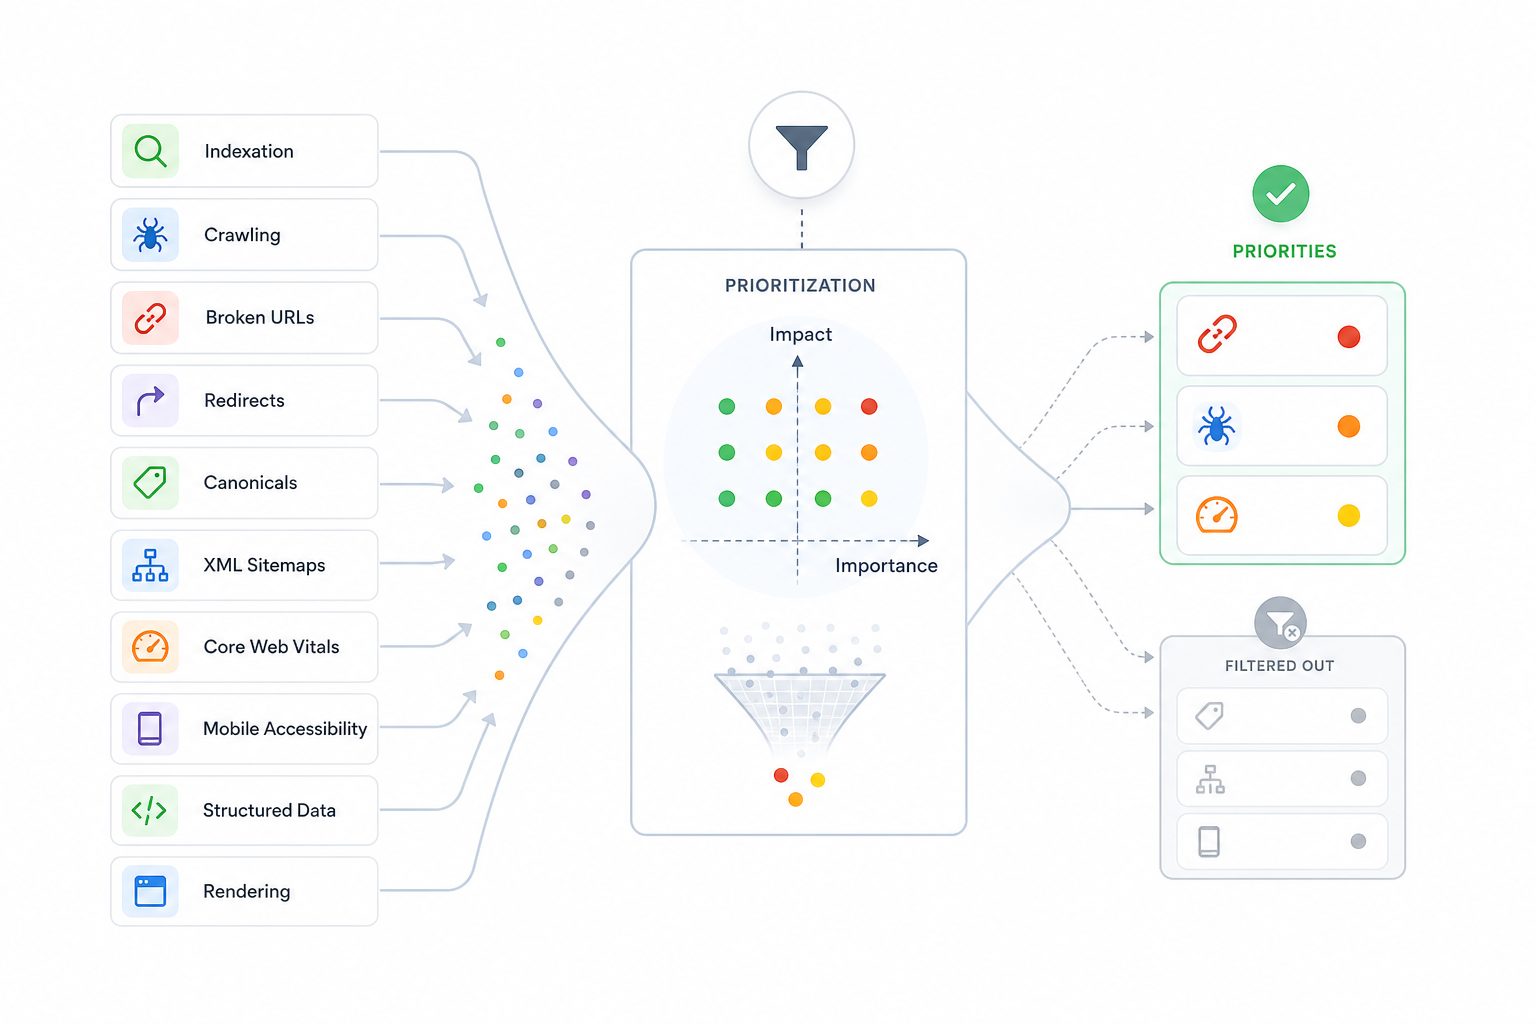
Report technical issues only when they materially affect important pages or website sections.
Relevant areas include:
- Indexation
- Crawling
- Broken URLs
- Redirects
- Canonicals
- XML sitemaps
- Core Web Vitals
- Mobile accessibility
- Structured data
- Rendering problems
Do not fill the report with every warning generated by a crawler.
Prioritize issues according to their likely search impact and the importance of the affected URLs.
Content and On-Page Performance
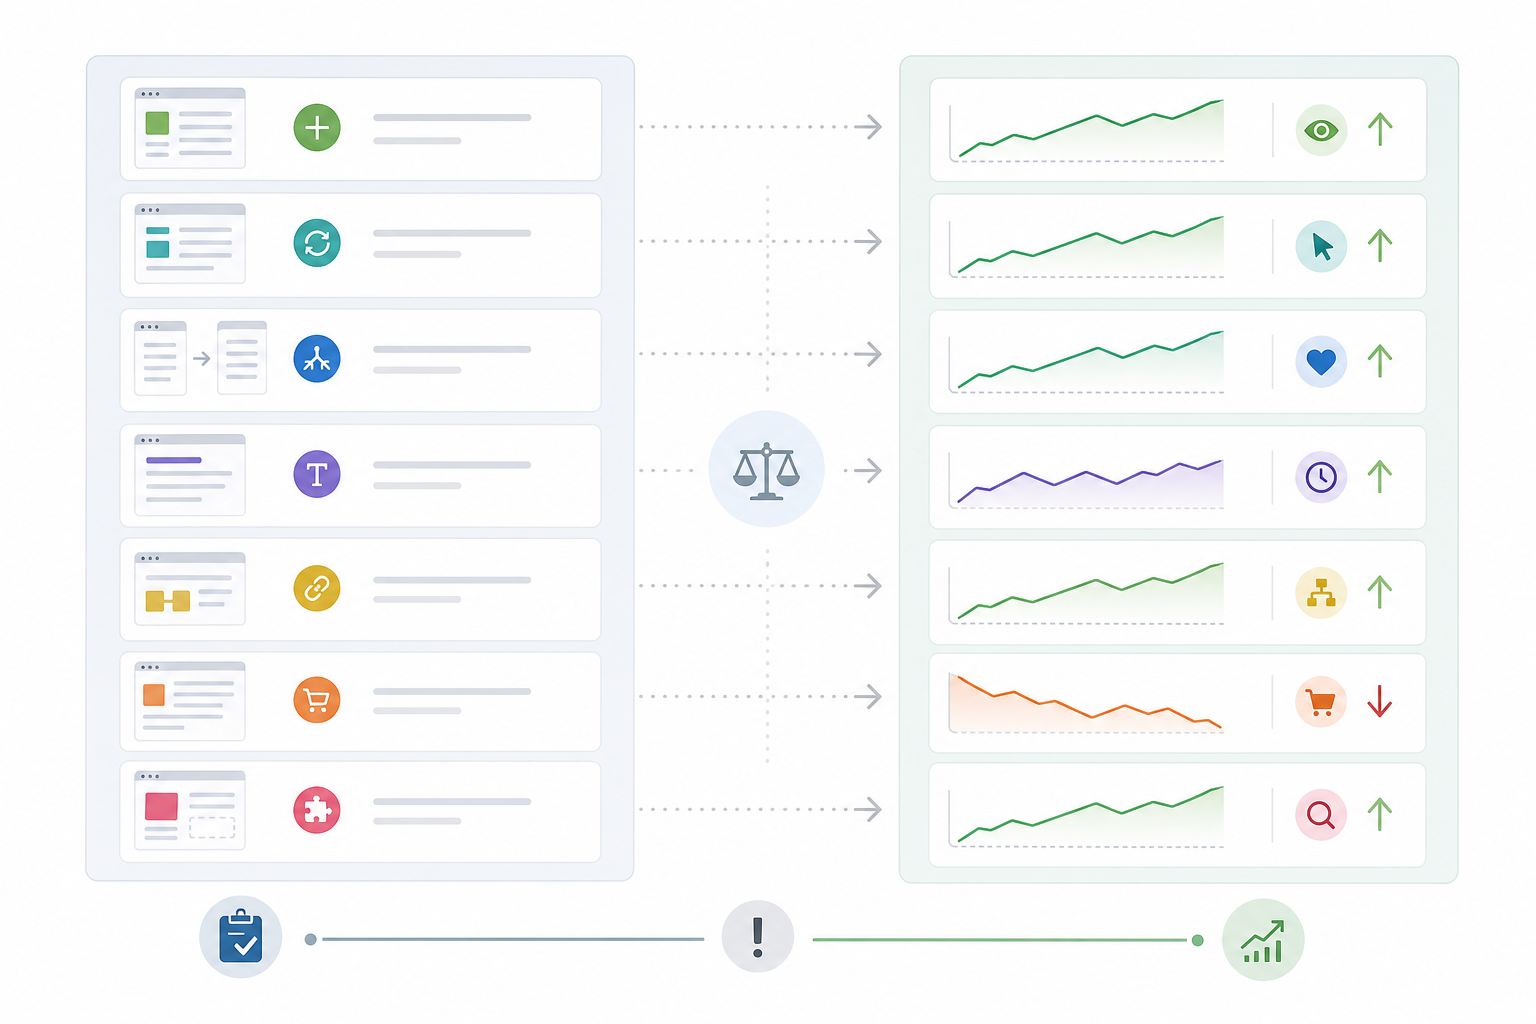
Summarize meaningful content and page-level work completed during the period.
This can include:
- New pages published
- Existing content refreshed
- Pages consolidated
- Titles or headings improved
- Internal links added
- Commercial pages updated
- Content gaps addressed
Where performance evidence exists, explain how affected pages changed after implementation.
Avoid treating the completed work itself as proof of impact.
Competitor Benchmarking
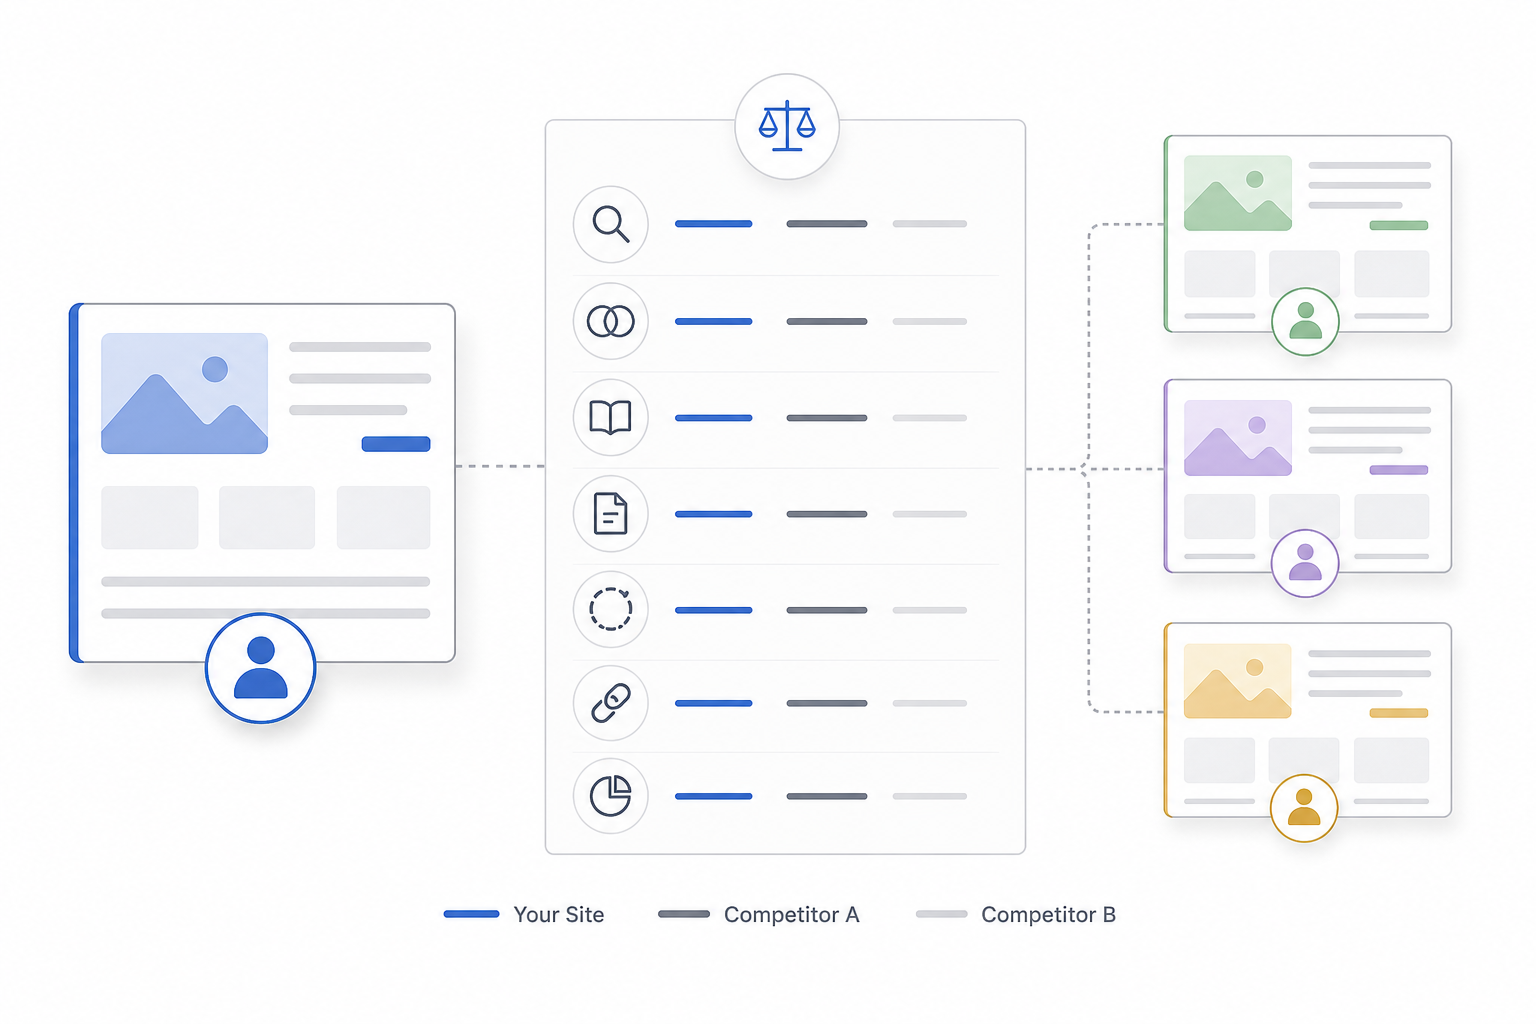
Competitor reporting can provide useful context when market movements help explain search performance.
Include relevant changes in:
- Search visibility
- Keyword overlap
- Topic coverage
- Ranking pages
- Content gaps
- Backlink strength
- Share of relevant search demand
Keep competitor reporting selective.
A recurring SEO report does not need to become a complete competitor-analysis document.
SEO Activity Completed
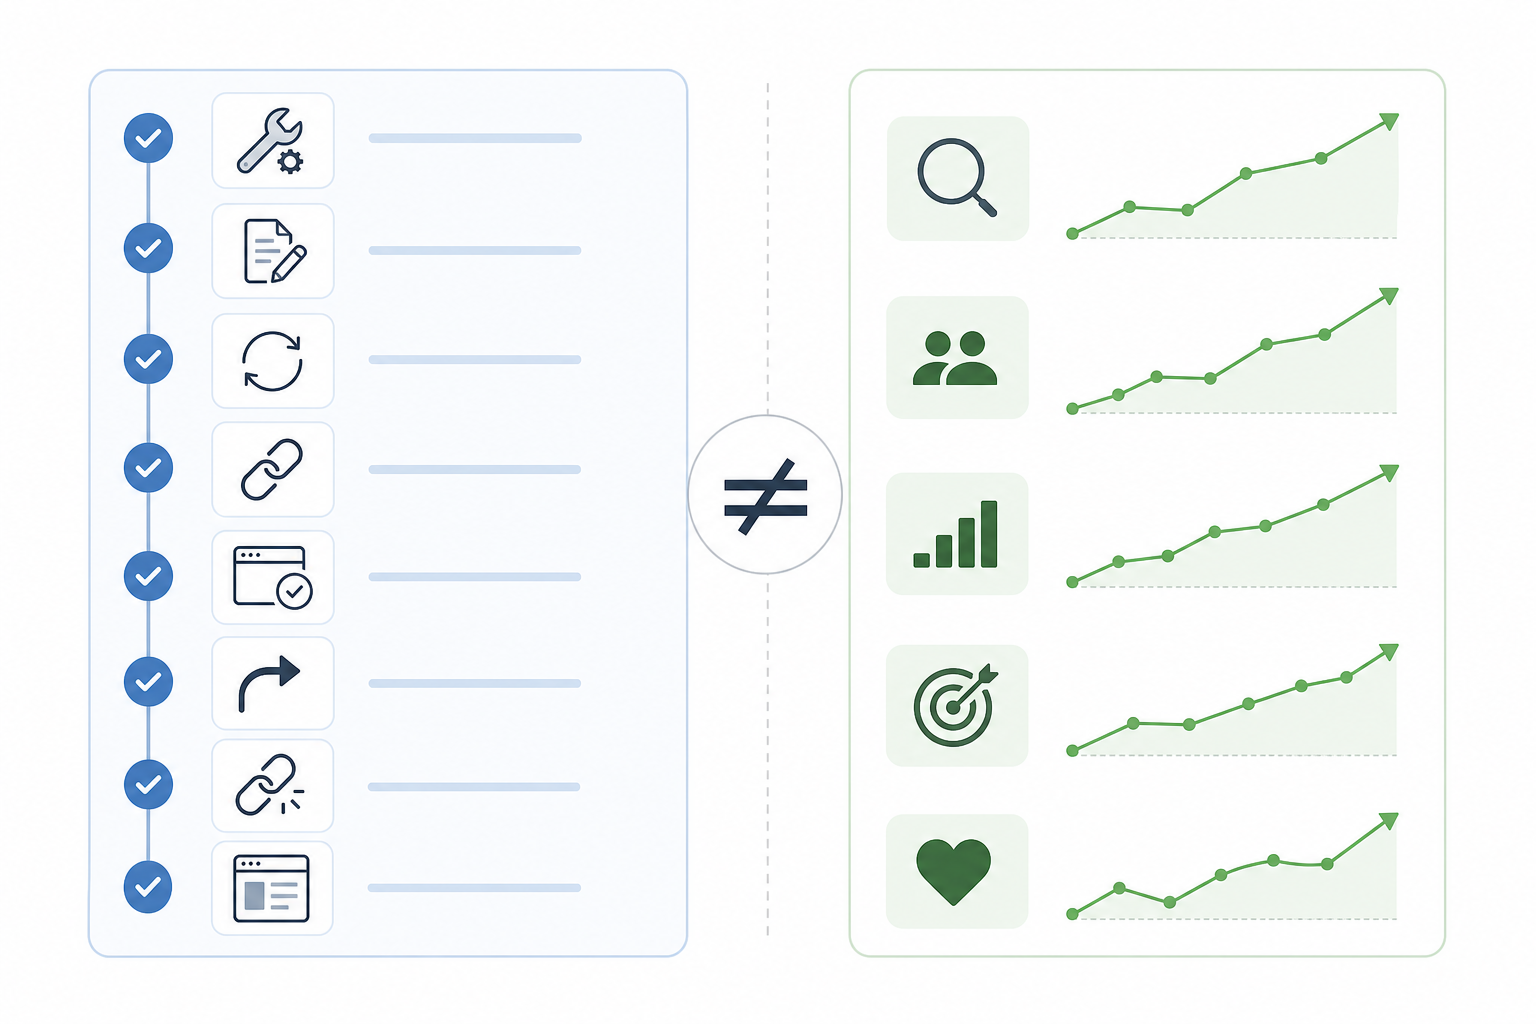
Document significant work delivered during the period.
Examples include:
- Technical fixes
- Content publication
- Content refreshes
- Internal-link improvements
- Page optimizations
- Redirect implementation
- Backlinks acquired
- New landing pages launched
Separate activity from results.
“10 pages optimized” explains delivery. It does not establish that those pages caused a traffic increase.
Issues and Risks
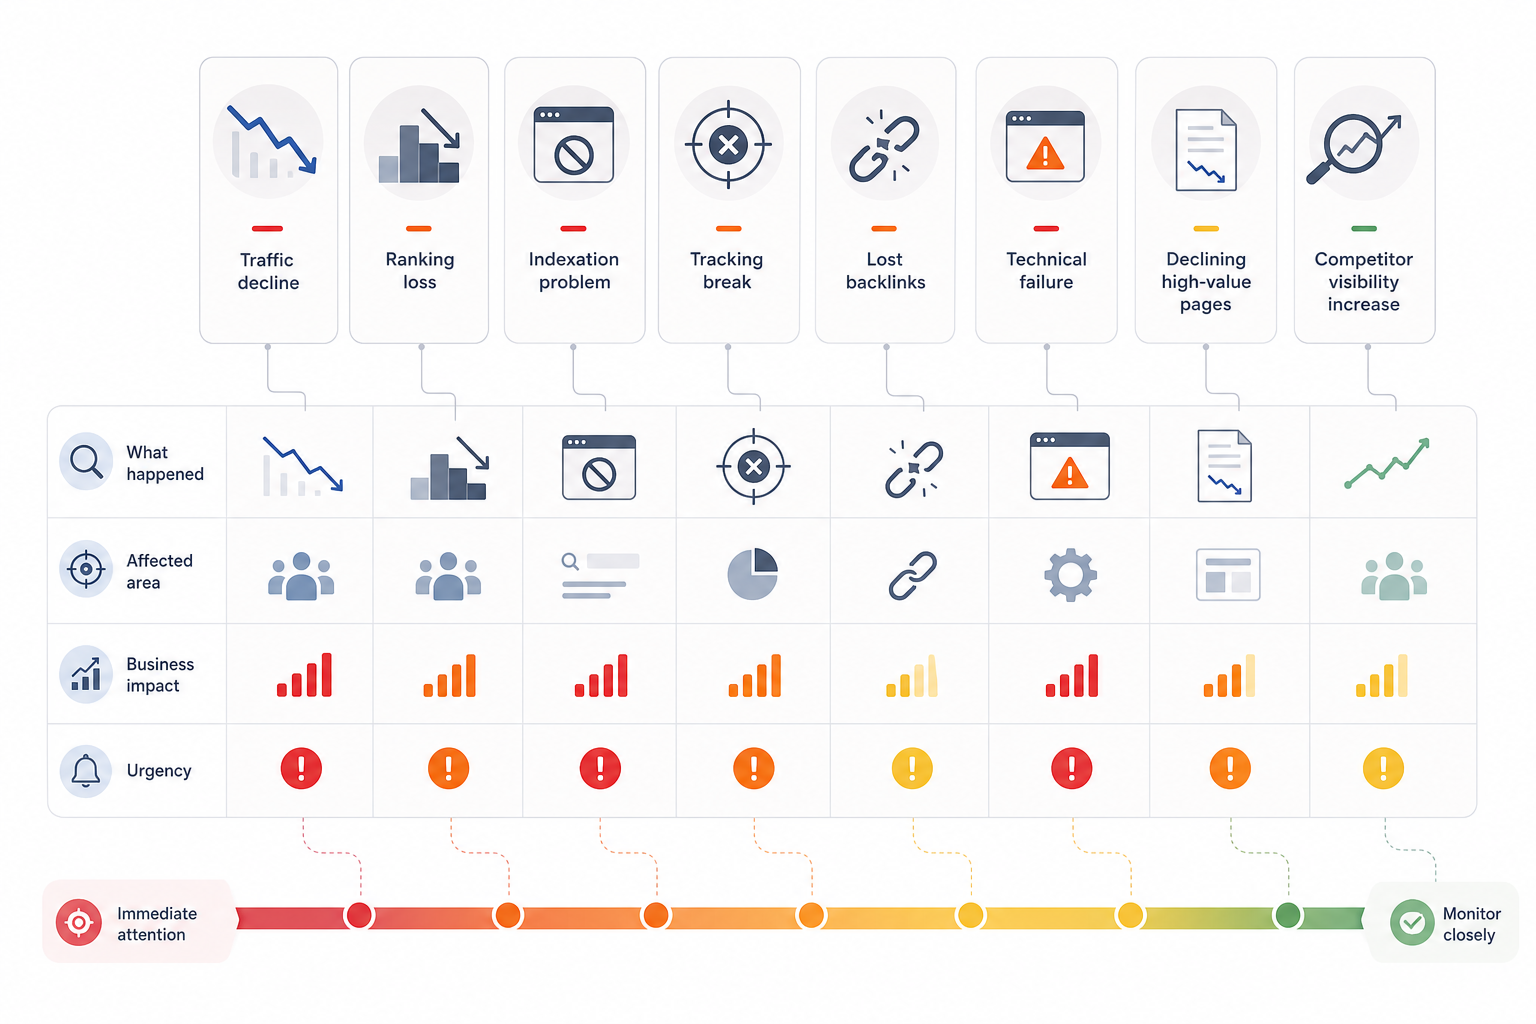
Highlight problems that require stakeholder attention.
Examples include:
- Organic traffic declines
- Ranking losses
- Indexation issues
- Tracking problems
- Important lost backlinks
- Technical failures
- Declining high-value pages
- Increased competitor visibility
Explain:
- What happened
- Which area is affected
- Why it matters
- How urgent it is
Recommendations and Next Actions
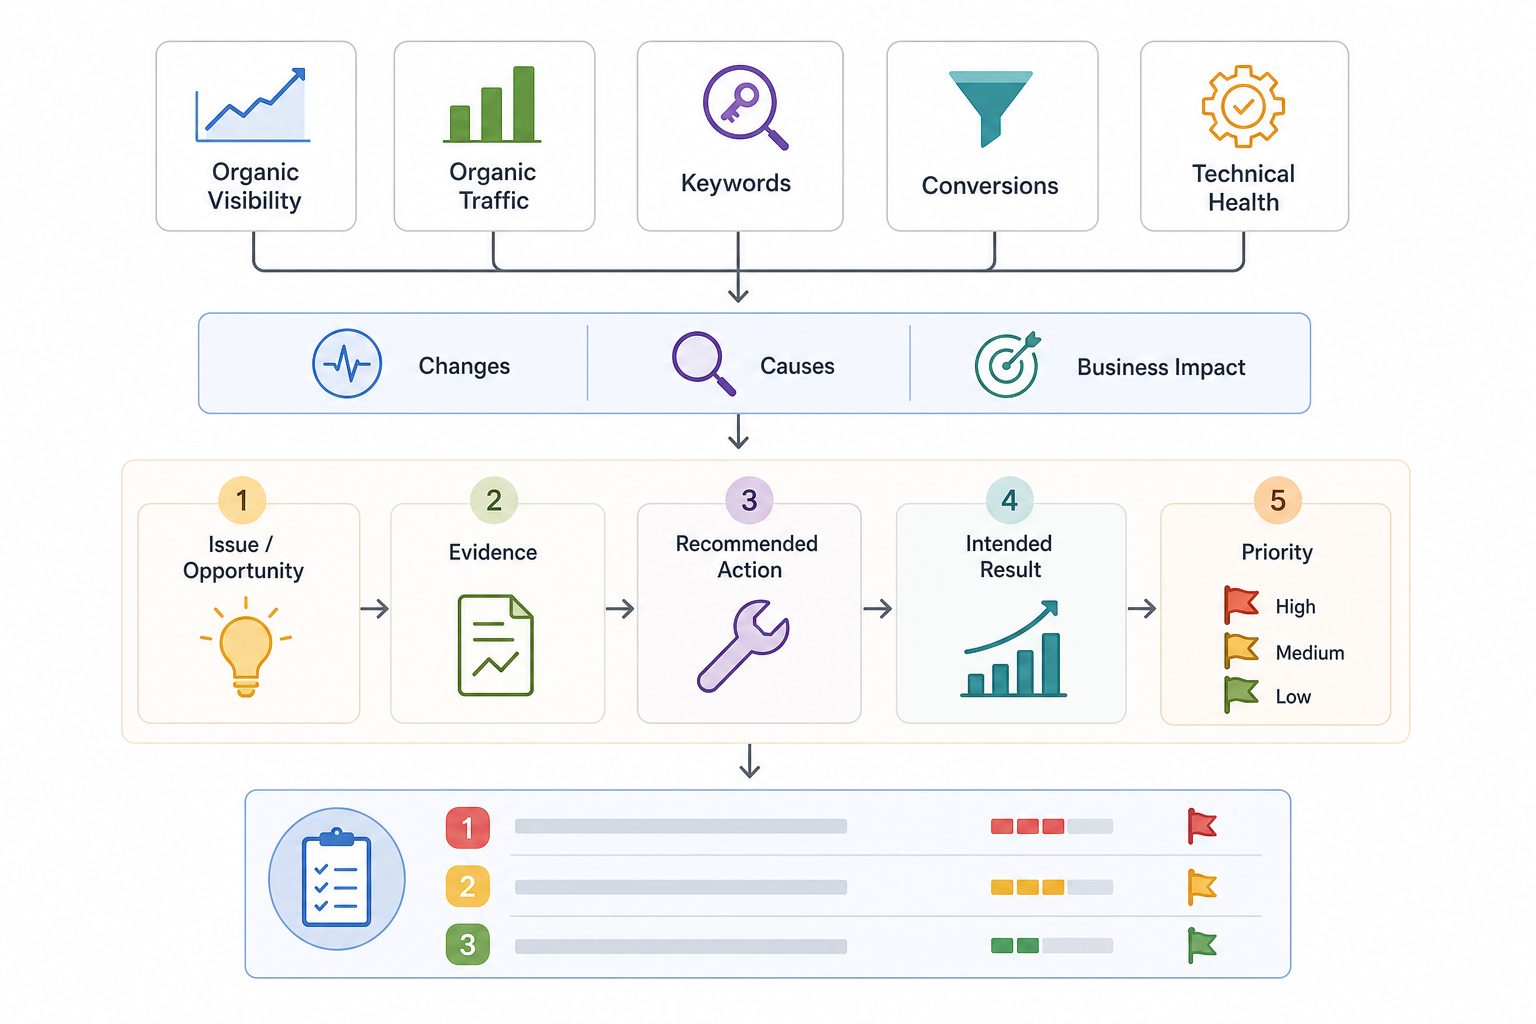
End the report with specific priorities.
Each recommendation should identify:
- The issue or opportunity
- Supporting evidence
- Recommended action
- Intended result
- Priority
A useful summary table can look like this:
| Report Section | Key Metrics / Information | What It Shows | Why It Matters |
|---|---|---|---|
| Organic Visibility | Impressions, clicks, CTR | Search exposure and engagement | Shows whether search presence is expanding |
| Organic Traffic | Sessions, users, landing pages | Visits from organic search | Shows how visibility translates into website traffic |
| Keywords | Priority rankings, topic groups | Competitive search positions | Identifies gains and losses across strategic demand |
| Conversions | Leads, sales, sign-ups | Business outcomes | Connects SEO with commercial value |
| Technical Health | Indexation, crawling, performance | Website constraints | Identifies technical barriers |
| Next Actions | Prioritized recommendations | Required work | Converts reporting into decisions |
A useful SEO report structure makes it clear what changed, what influenced the change, what business impact followed, and what deserves priority next.
What Structure, Template, and Format Should an SEO Report Use?
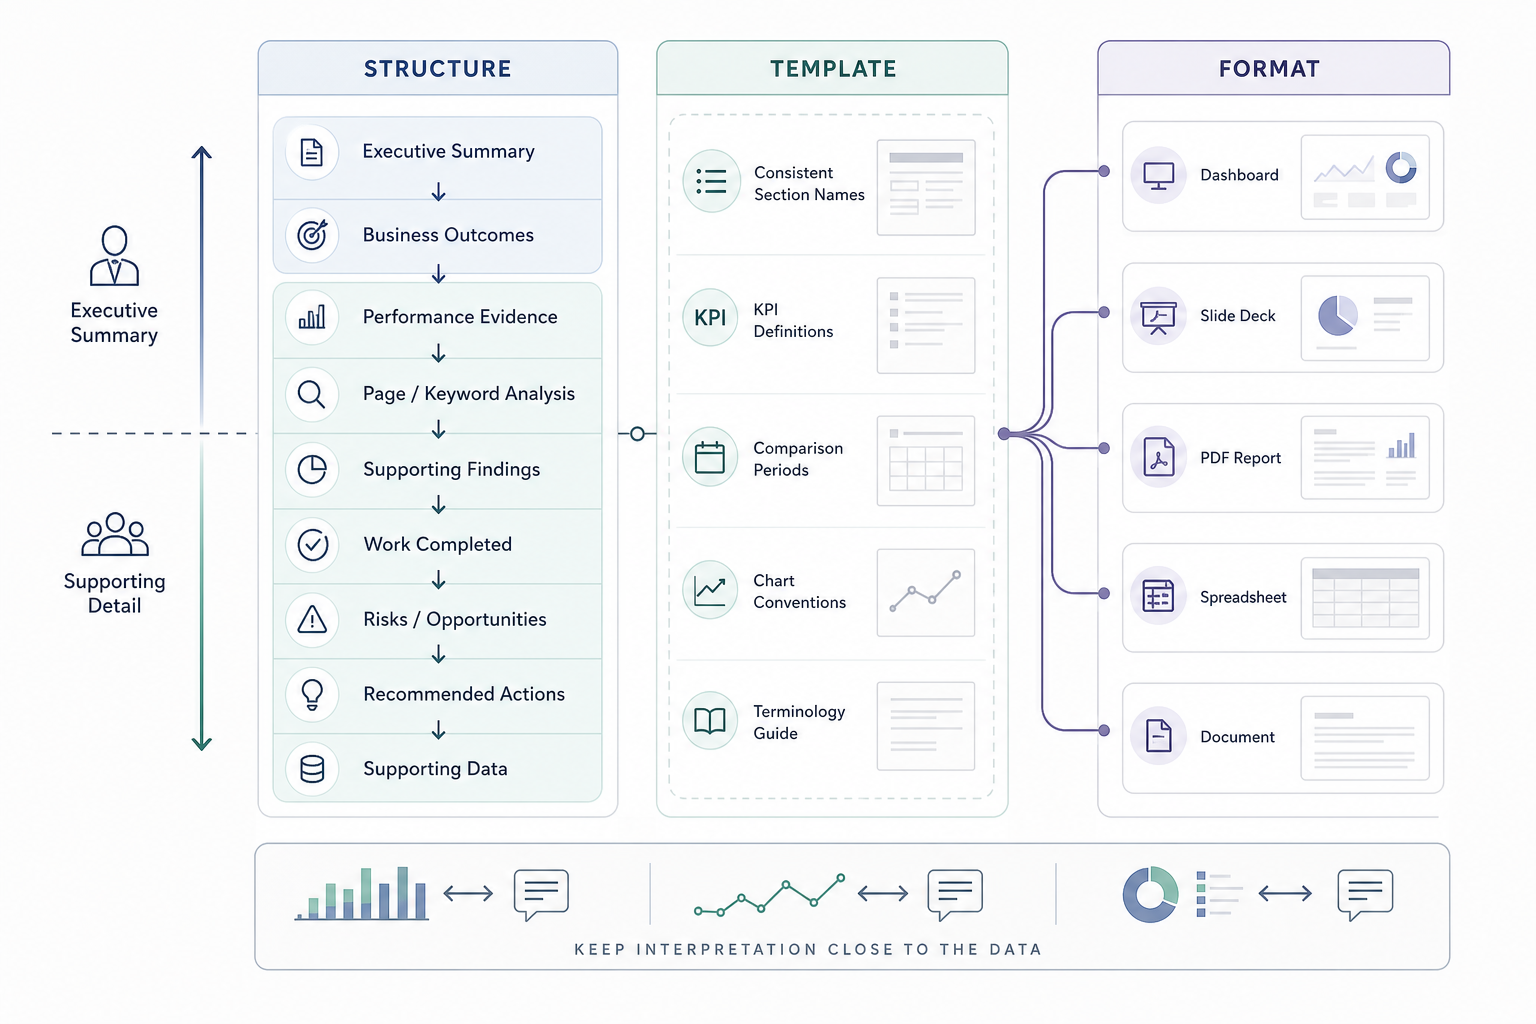
An SEO report should use a consistent information hierarchy that moves from the most important conclusion into supporting evidence, interpretation, and next actions.
Structure, template, and format describe different parts of the reporting system.
- Structure defines the order in which information appears.
- Template provides a reusable reporting framework.
- Format defines how the final report is delivered.
SEO Report Structure
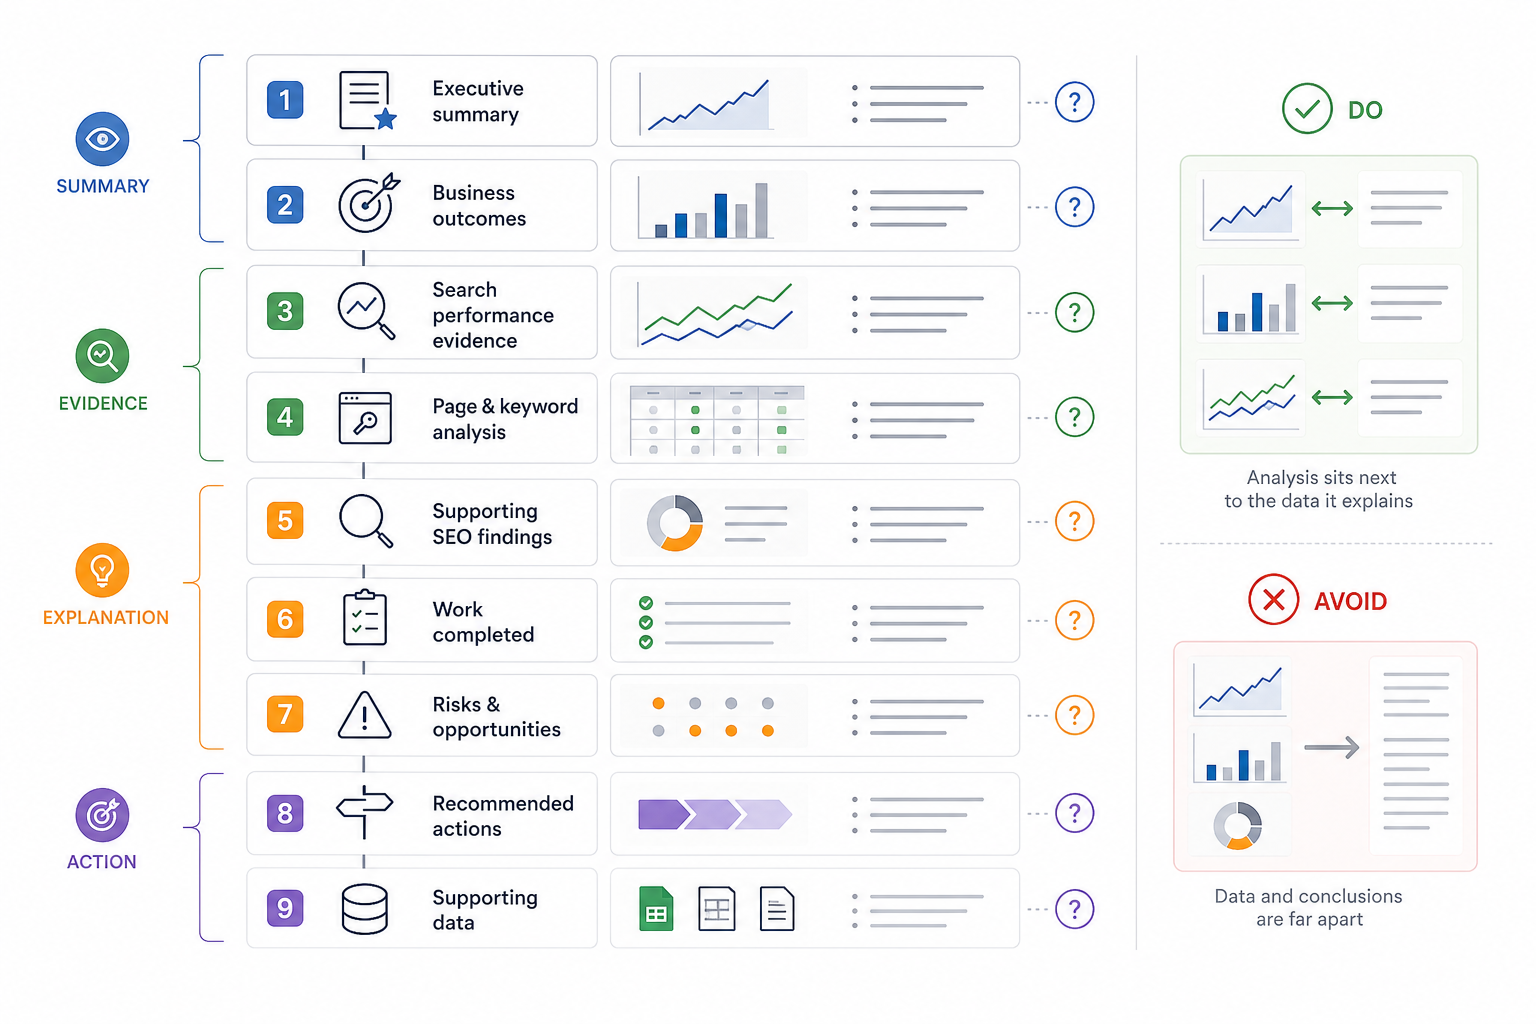
The report should begin with information that requires the least technical knowledge and then provide deeper supporting detail.
A practical structure can contain:
- Executive summary
- Business outcomes
- Search-performance evidence
- Page and keyword analysis
- Important supporting SEO findings
- Work completed
- Risks and opportunities
- Recommended actions
- Supporting data where required
Each major section should answer a reporting question.
For example:
- What changed?
- Why does it matter?
- What evidence supports the conclusion?
- What likely influenced the result?
- What needs to happen next?
Keep analysis close to the data it explains.
Avoid placing ten pages of charts at the beginning and providing interpretation only at the end. Separating evidence from meaning makes reports harder to understand.
SEO Report Template
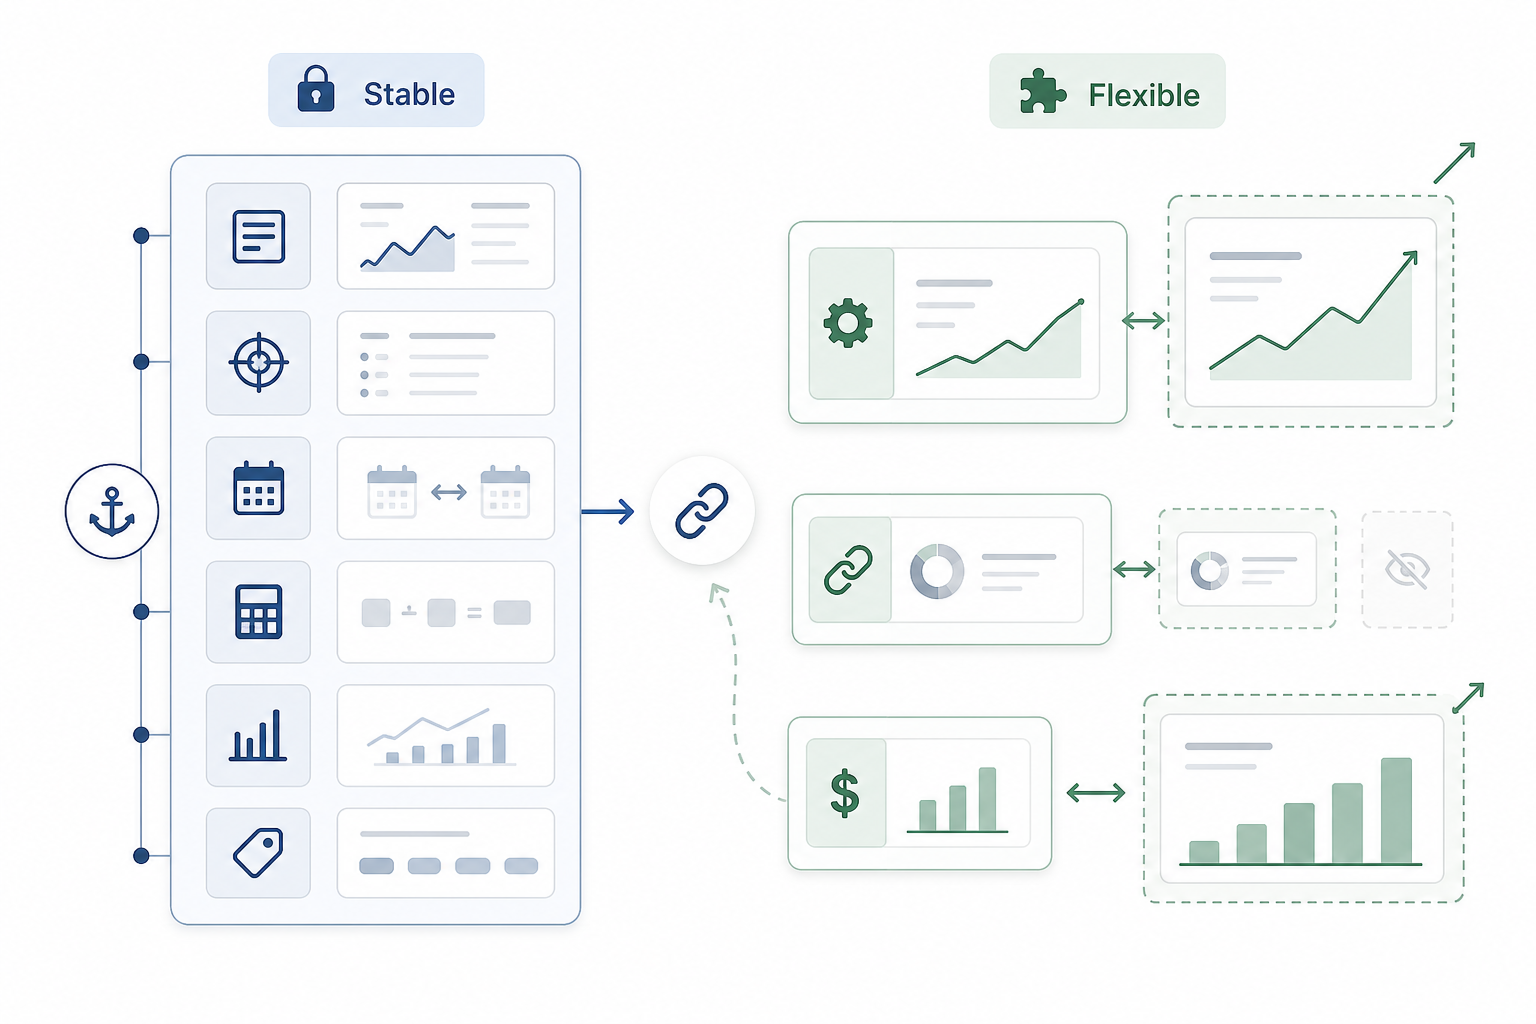
An SEO report template creates consistency across recurring reporting periods.
Keep important elements reasonably stable, such as:
- Section names
- KPI definitions
- Comparison periods
- Calculation methods
- Chart conventions
- Terminology
Consistency helps stakeholders compare one reporting period with another.
The template still requires flexibility.
A technical SEO section can become more prominent during a migration. A backlink section can remain minimal when off-page work is not an active part of the strategy. A revenue section can become central for ecommerce but irrelevant for a website without ecommerce tracking.
Do not include a reporting module simply because it exists in the template.
Reporting Depth
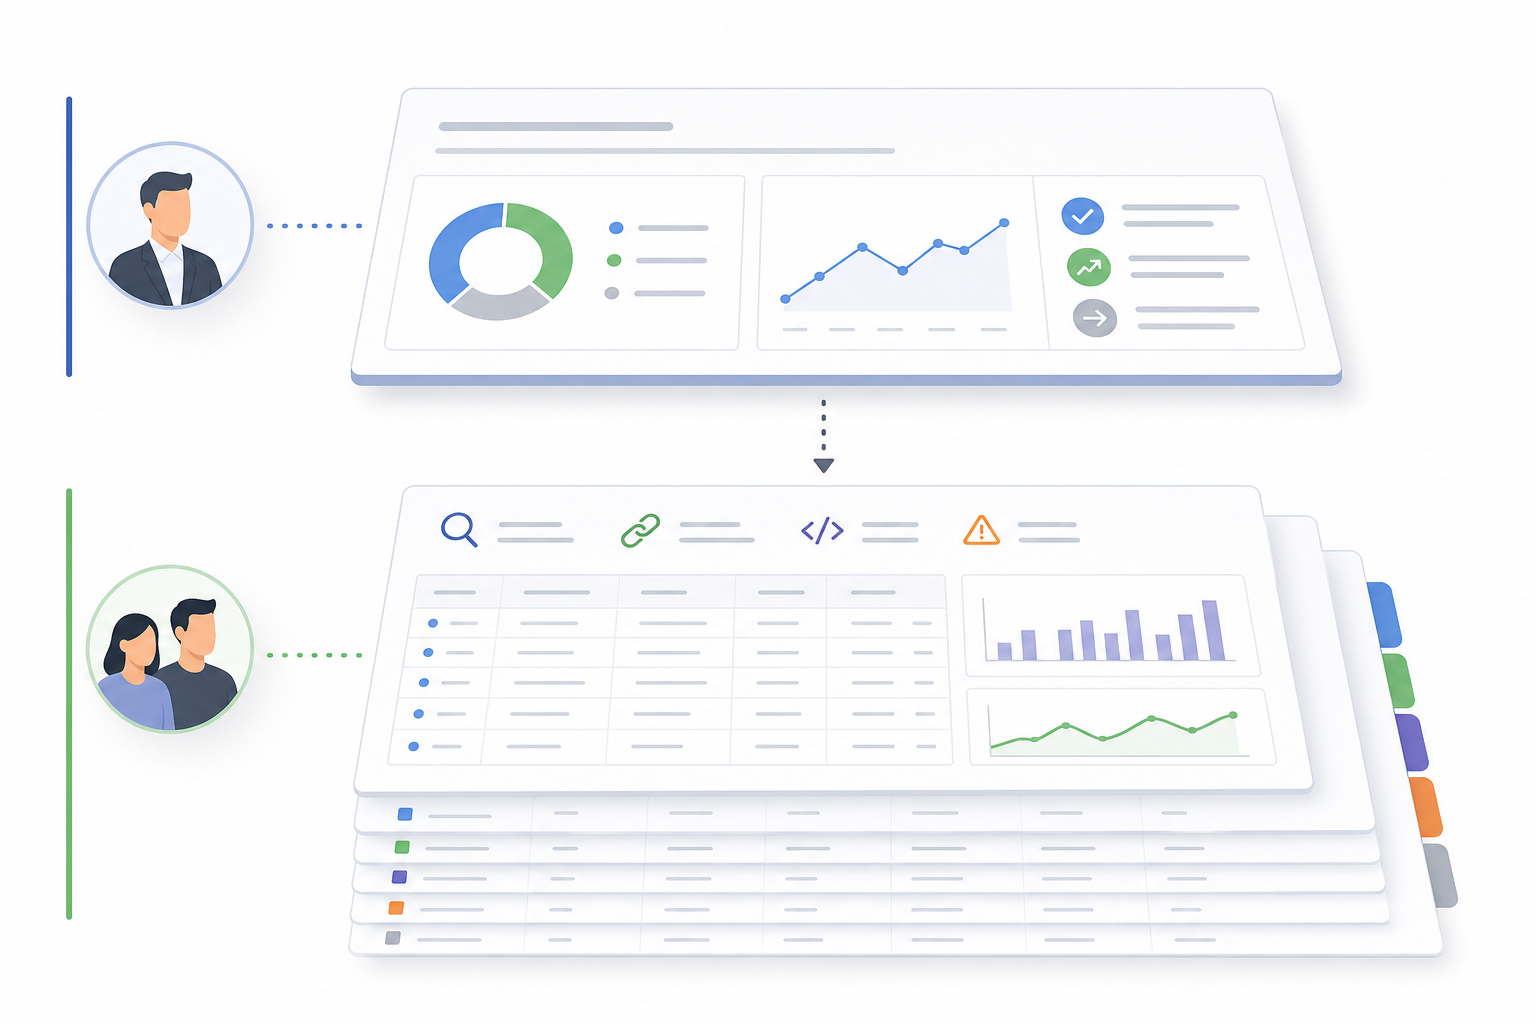
Use different levels of detail for different readers.
The primary report can provide:
- Summary
- Important evidence
- Decisions
Supporting material can contain:
- Full keyword datasets
- Technical exports
- Backlink lists
- URL-level detail
- Larger charts
- Additional diagnostics
Executives can stop after the strategic summary, while SEO and implementation teams can access the deeper detail.
SEO Report Formats
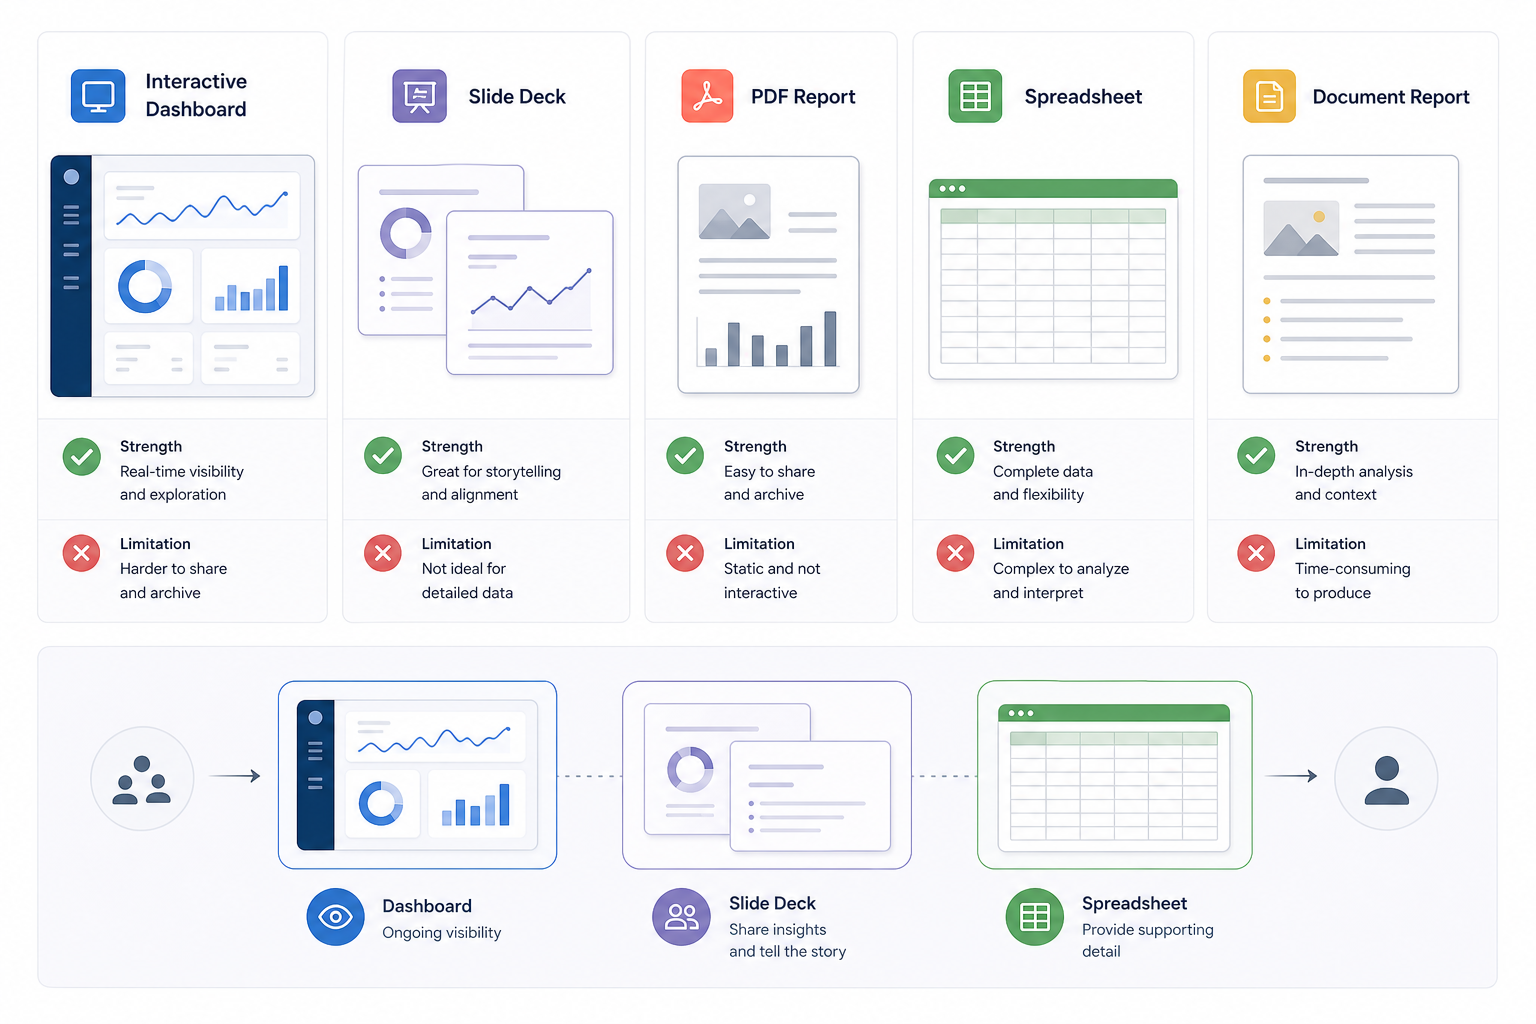
Different formats serve different reporting needs.
| Format | Best Use | Strength | Limitation |
|---|---|---|---|
| Interactive Dashboard | Recurring KPI monitoring | Live or frequently refreshed data | Limited interpretation by itself |
| Slide Deck | Monthly or quarterly presentations | Strong for discussion and storytelling | Less suitable for detailed datasets |
| Fixed-period reports | Easy to distribute and archive | Static after export | |
| Spreadsheet | Detailed operational data | Strong for keywords, URLs, backlinks, and technical findings | Can become difficult for non-technical stakeholders |
| Document Report | Detailed written analysis | Strong explanatory depth | Less visual than a presentation |
Several formats can work together.
A dashboard can provide continuous KPI visibility, while a monthly deck explains the important changes and recommendations. A spreadsheet can contain the underlying keyword or technical data without overcrowding the main report.
The best SEO report template depends on the audience, reporting objective, frequency, complexity of the data, and how stakeholders use the information.
What Does an SEO Report Example Look Like?
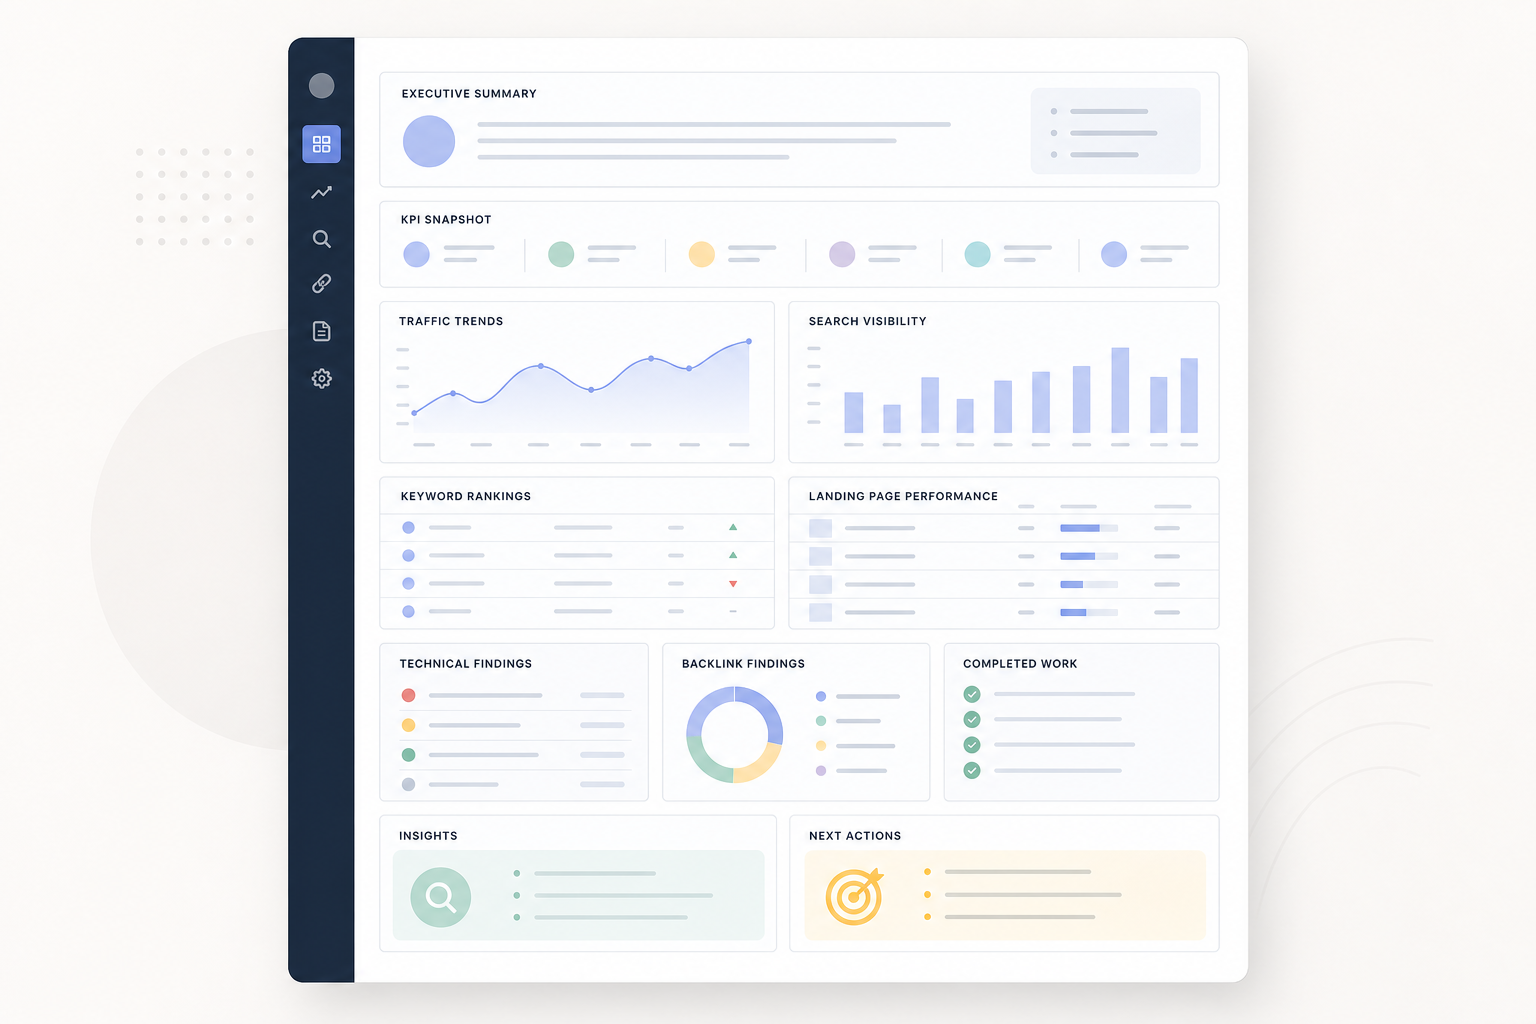
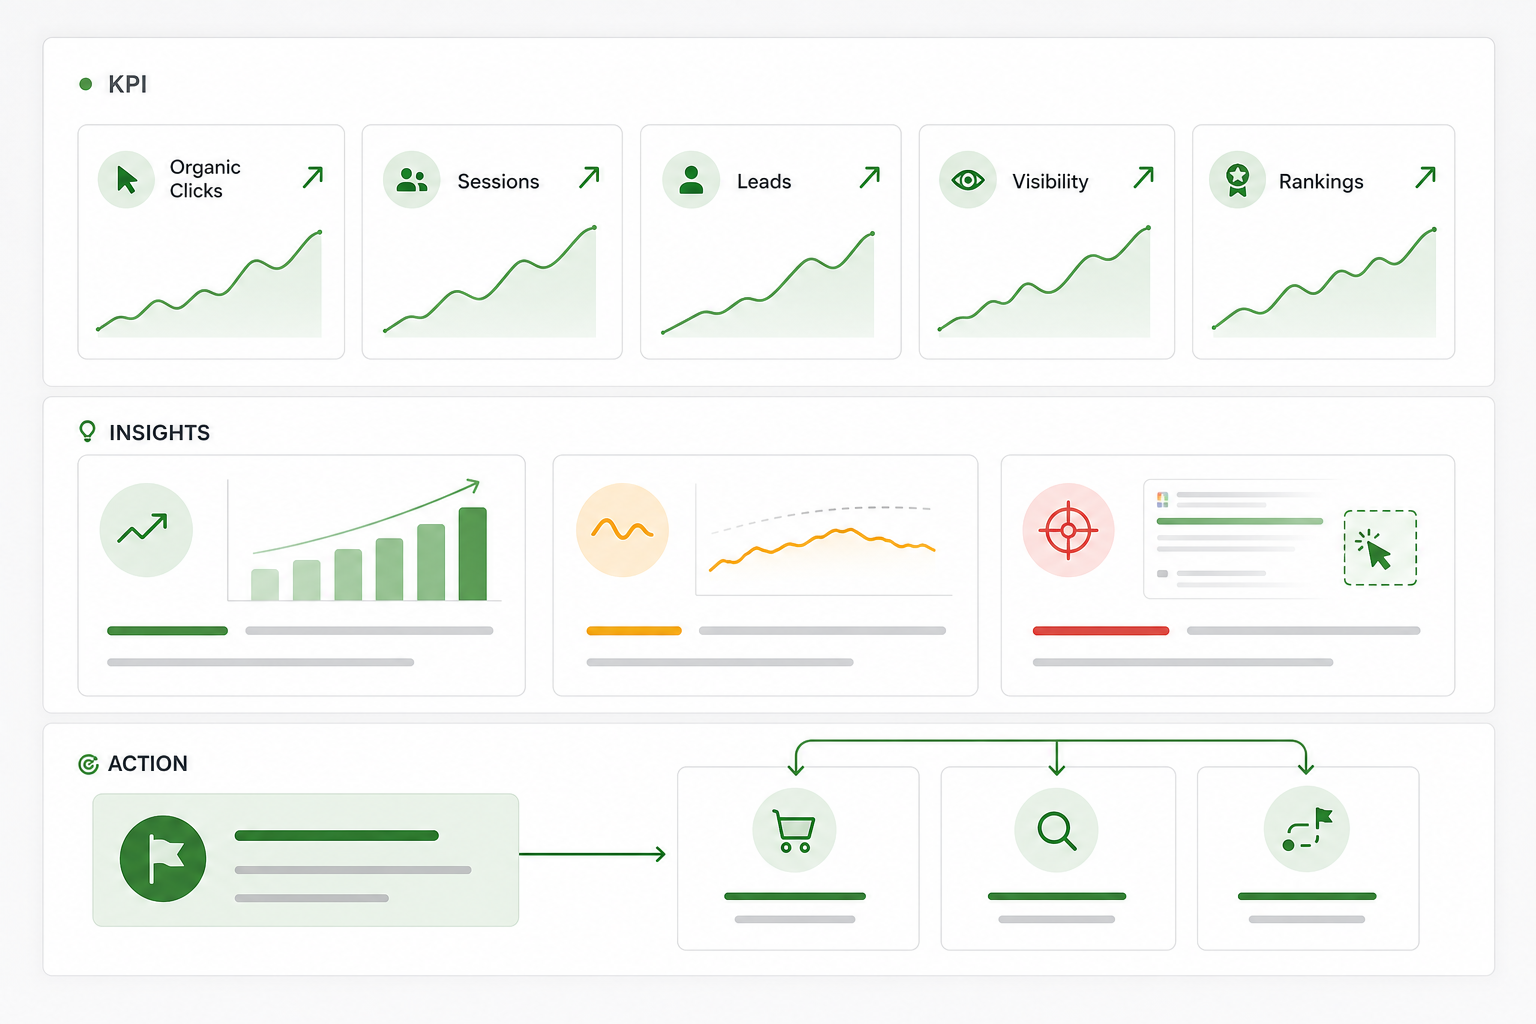
A typical SEO report begins with an executive summary and KPI snapshot, then expands into traffic, search visibility, rankings, landing-page performance, technical or backlink findings, completed work, insights, and next actions.
Consider a hypothetical monthly SEO report.
All figures below are illustrative.
Page 1: Executive Summary
Headline metrics
- Organic clicks: +18%
- Organic sessions: +14%
- Organic leads: +9%
- Non-branded visibility: +11%
- Priority keywords in Top 10: +12
Key insights
- Organic growth came primarily from three priority content clusters.
- Commercial landing-page traffic increased, but conversion growth remained slower than traffic growth.
- Several high-impression pages continue to generate below-average CTR.
Primary next action
Improve SERP positioning and conversion paths across the highest-impression commercial pages.
Traffic and Conversion Performance
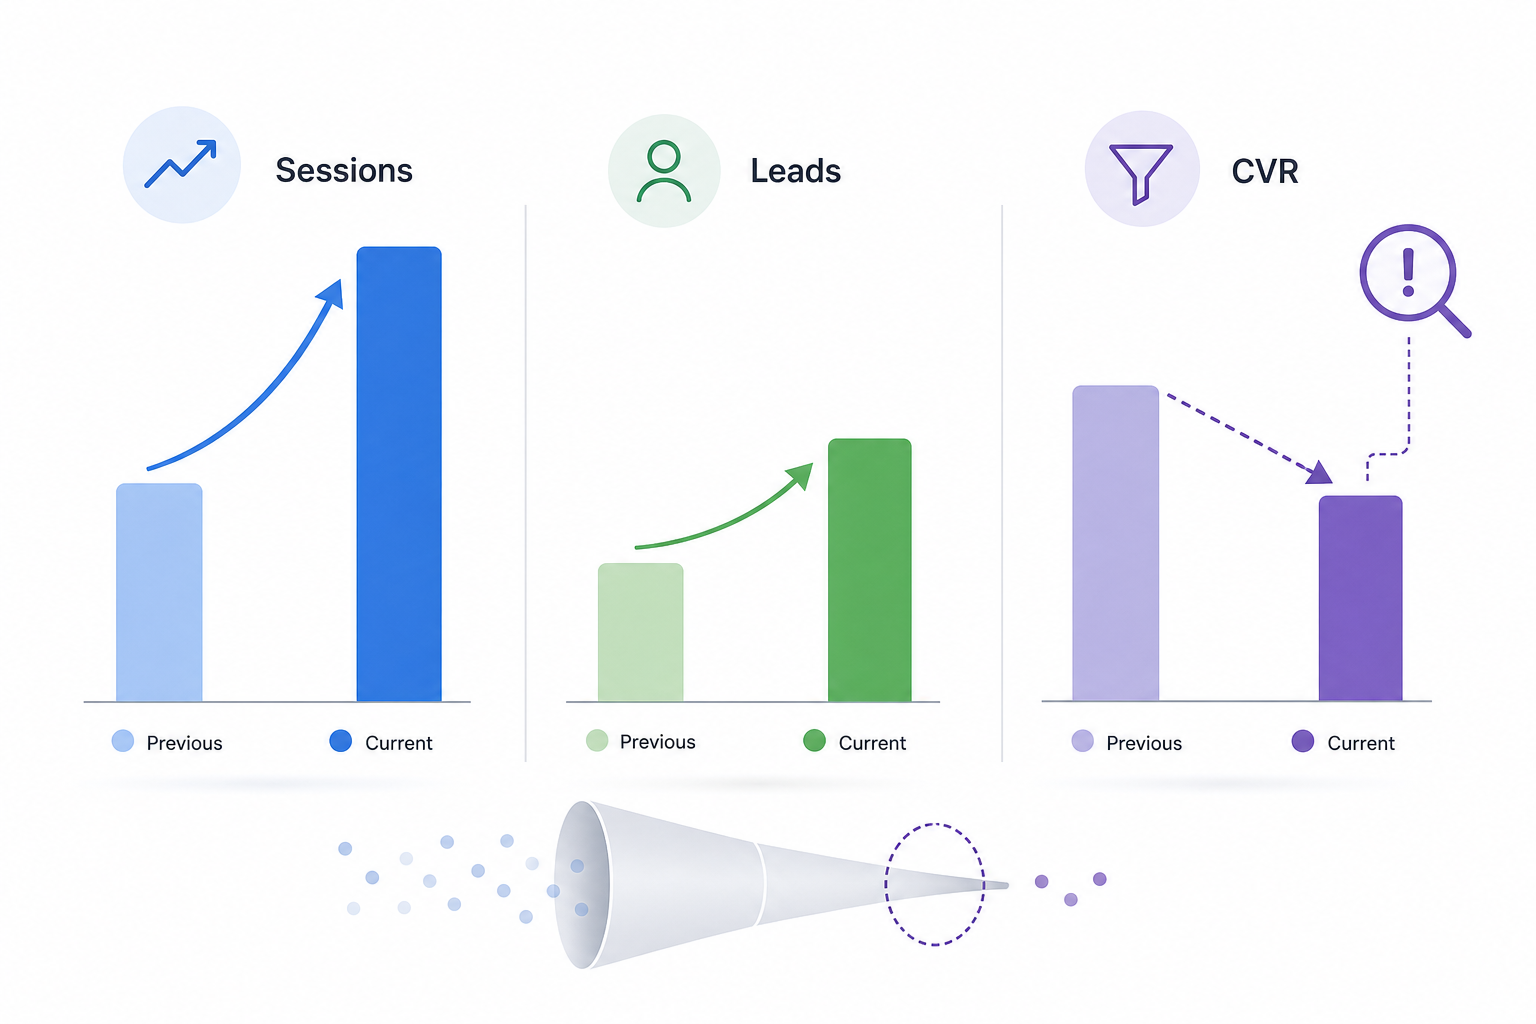
| Metric | Current Period | Previous Period | Change |
|---|---|---|---|
| Organic Sessions | 58,000 | 50,900 | +14% |
| Organic Leads | 436 | 400 | +9% |
| Conversion Rate | 0.75% | 0.79% | -0.04 pp |
Interpretation: Organic traffic increased faster than lead generation. Further analysis is required on high-growth landing pages to determine whether the new traffic is less commercially qualified or whether conversion paths require improvement.
Search Visibility Performance
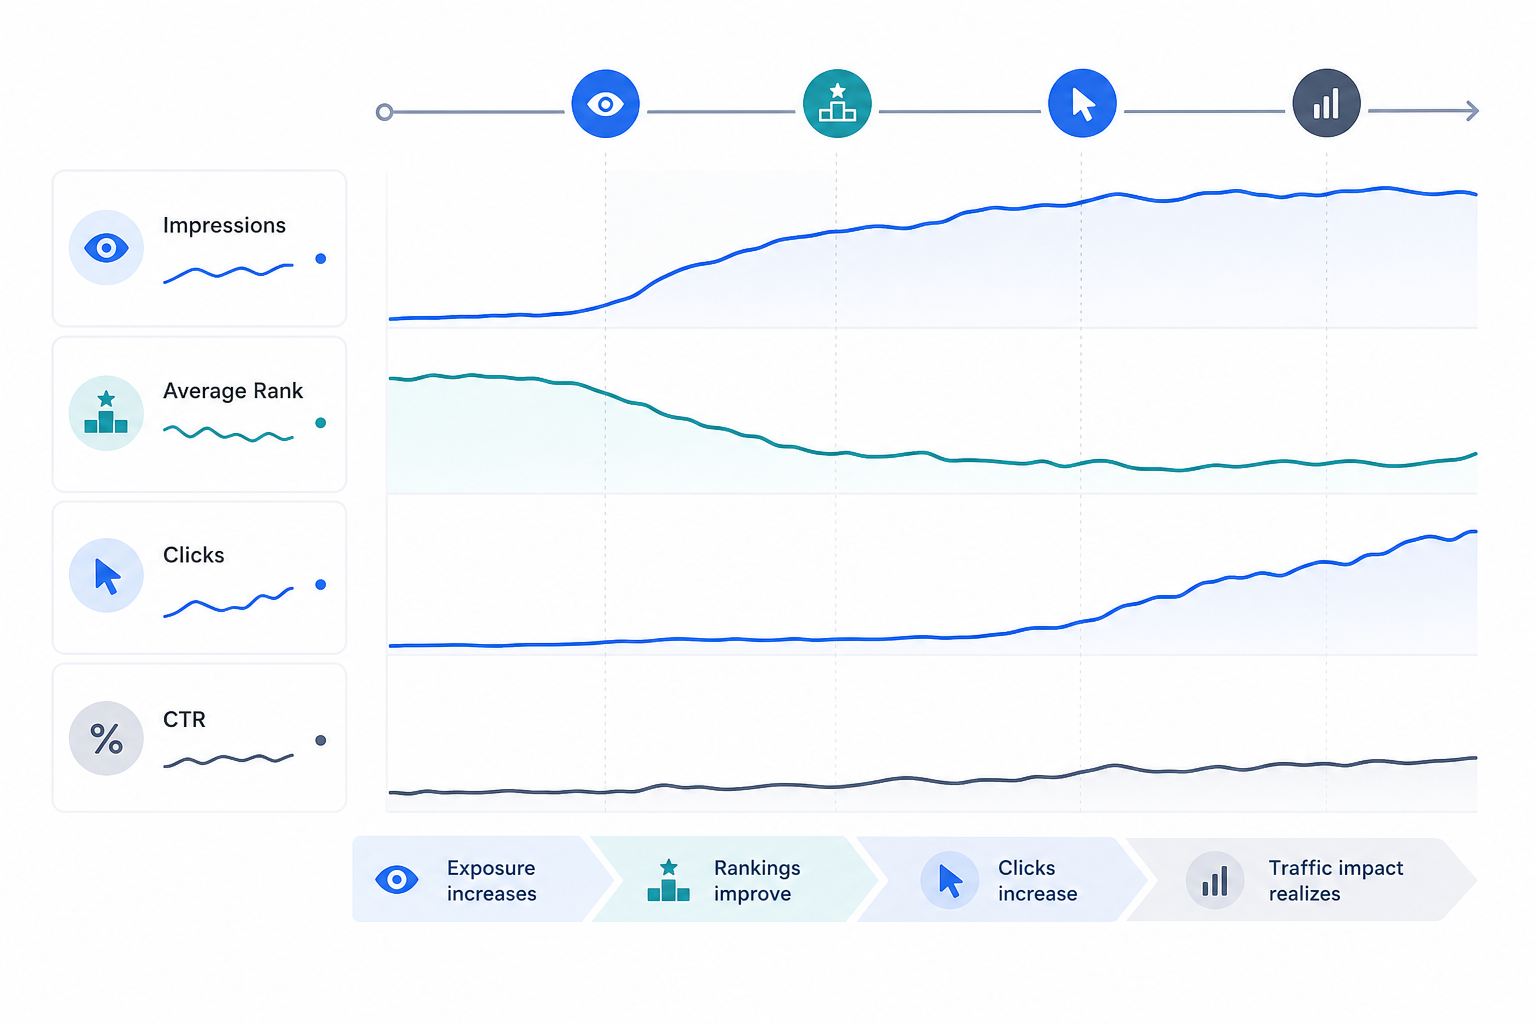
Report:
- Search clicks
- Impressions
- CTR
- Relevant ranking trends
Example insight:
Visibility increased across the priority topic cluster before the full traffic increase became visible, indicating broader search exposure across the relevant query set.
Keyword Performance
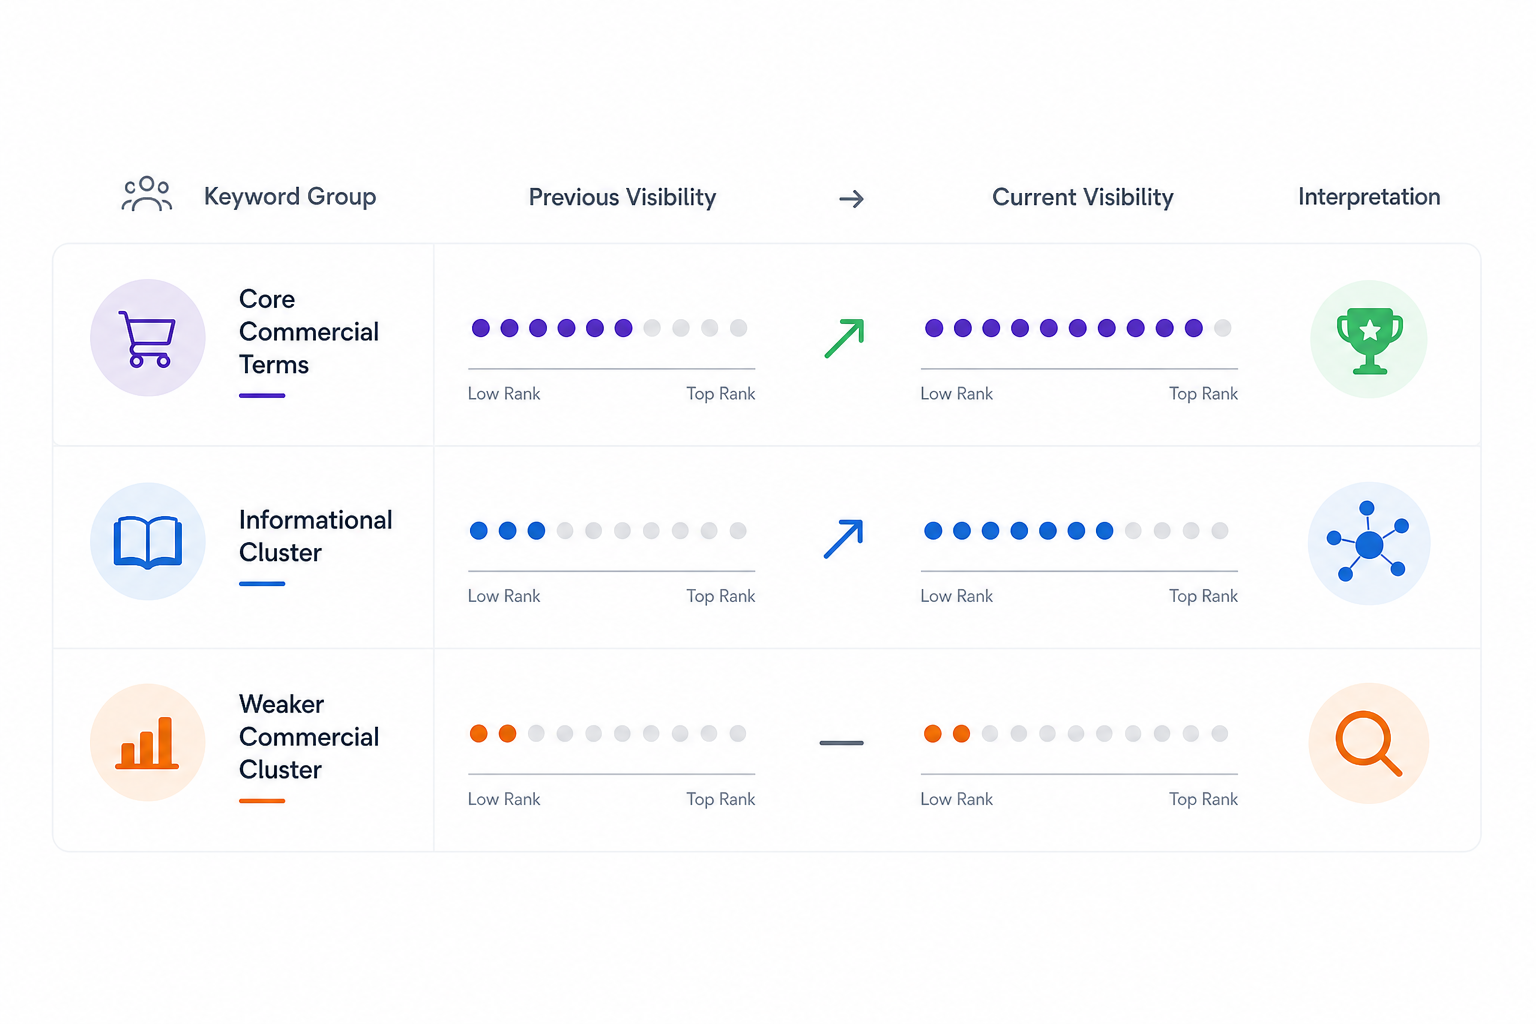
Focus on important terms.
| Keyword Group | Previous Visibility | Current Visibility | Interpretation |
|---|---|---|---|
| Core commercial terms | Moderate | Improved | Several priority queries moved into Top 10 |
| Informational cluster A | Strong | Stronger | Existing pages gained broader query coverage |
| Commercial cluster B | Weak | Flat | Requires further content and authority analysis |
Do not fill the report with every tracked keyword.
Landing-Page and Content Performance
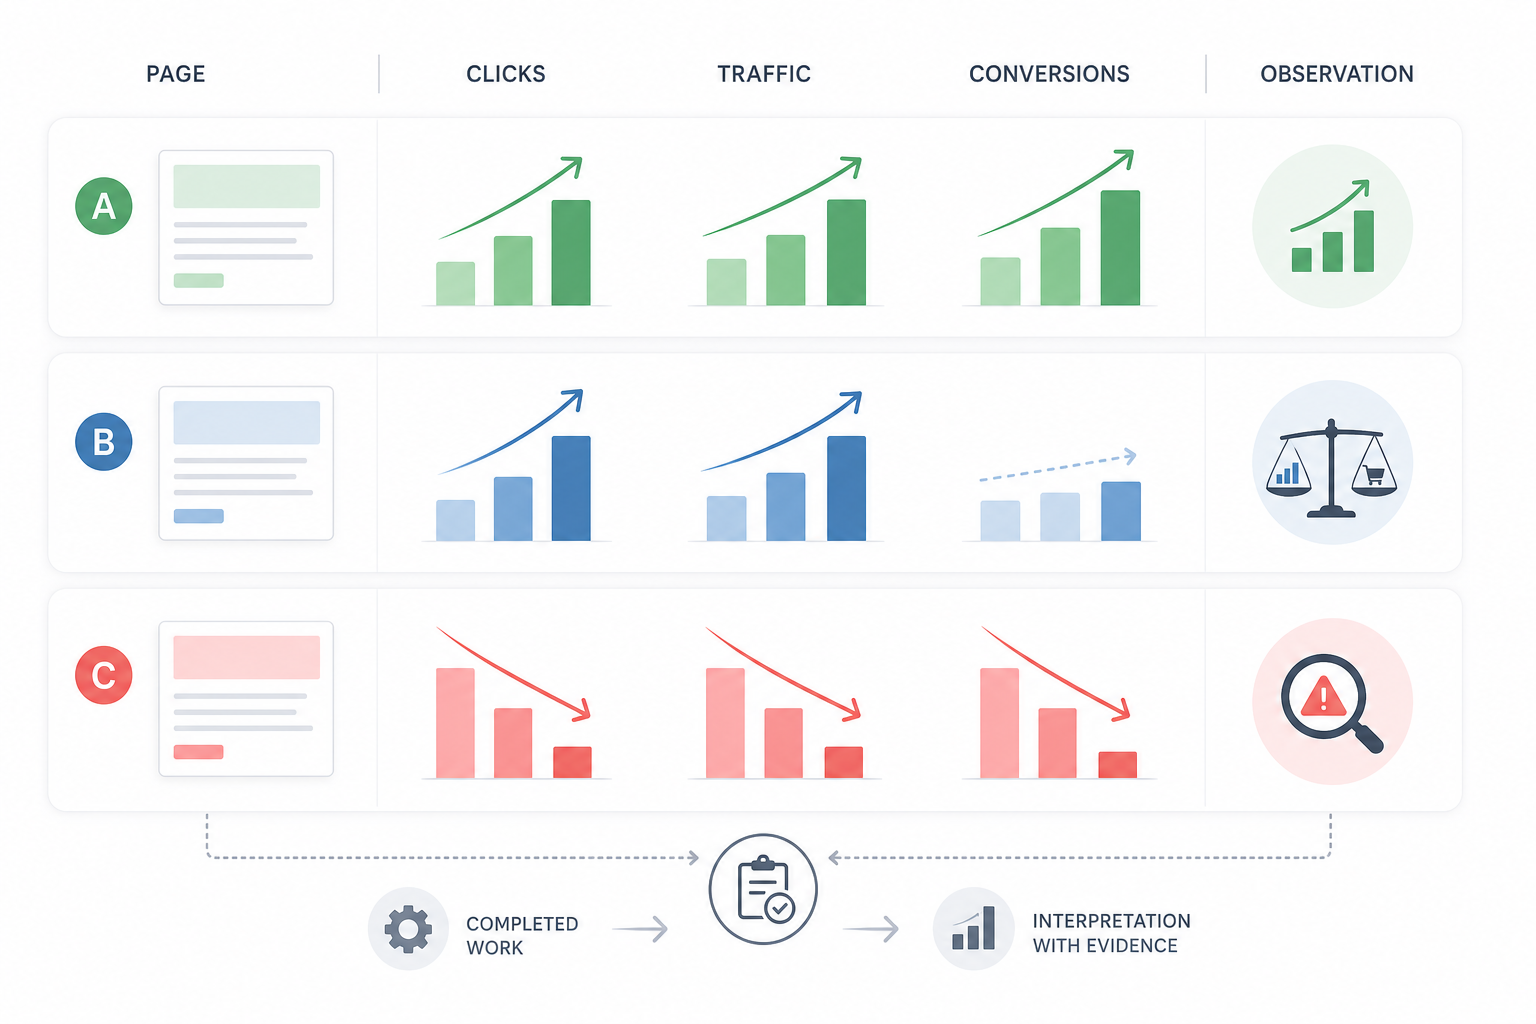
Show the pages contributing most to growth or decline.
| Landing Page | Click Change | Traffic Change | Conversions | Observation |
|---|---|---|---|---|
| Page A | +32% | +28% | +15% | Strong visibility and conversion growth |
| Page B | +24% | +22% | +3% | Traffic growth exceeds conversion growth |
| Page C | -18% | -15% | -12% | Requires intent and competitor review |
Connect important changes with work completed only where the evidence supports that relationship.
Backlink Performance
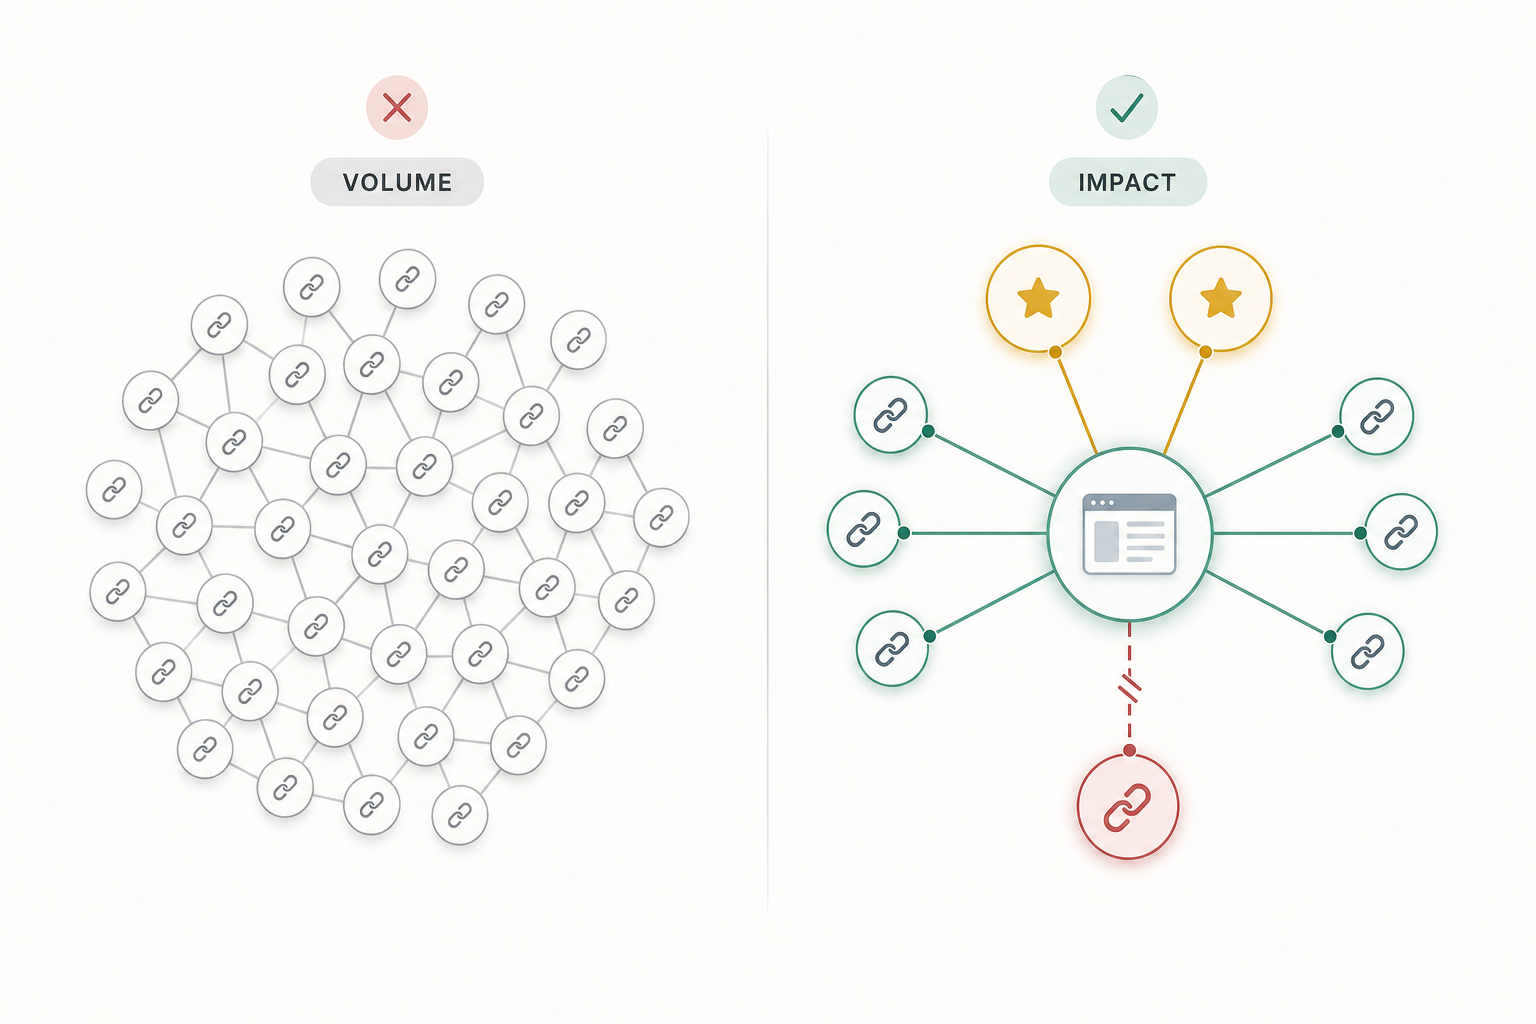
Report meaningful authority changes.
Example:
- 8 new relevant referring domains
- 2 high-value editorial links gained
- 1 important referring domain lost
Explain their relevance rather than emphasizing total backlink volume.
Technical SEO Health
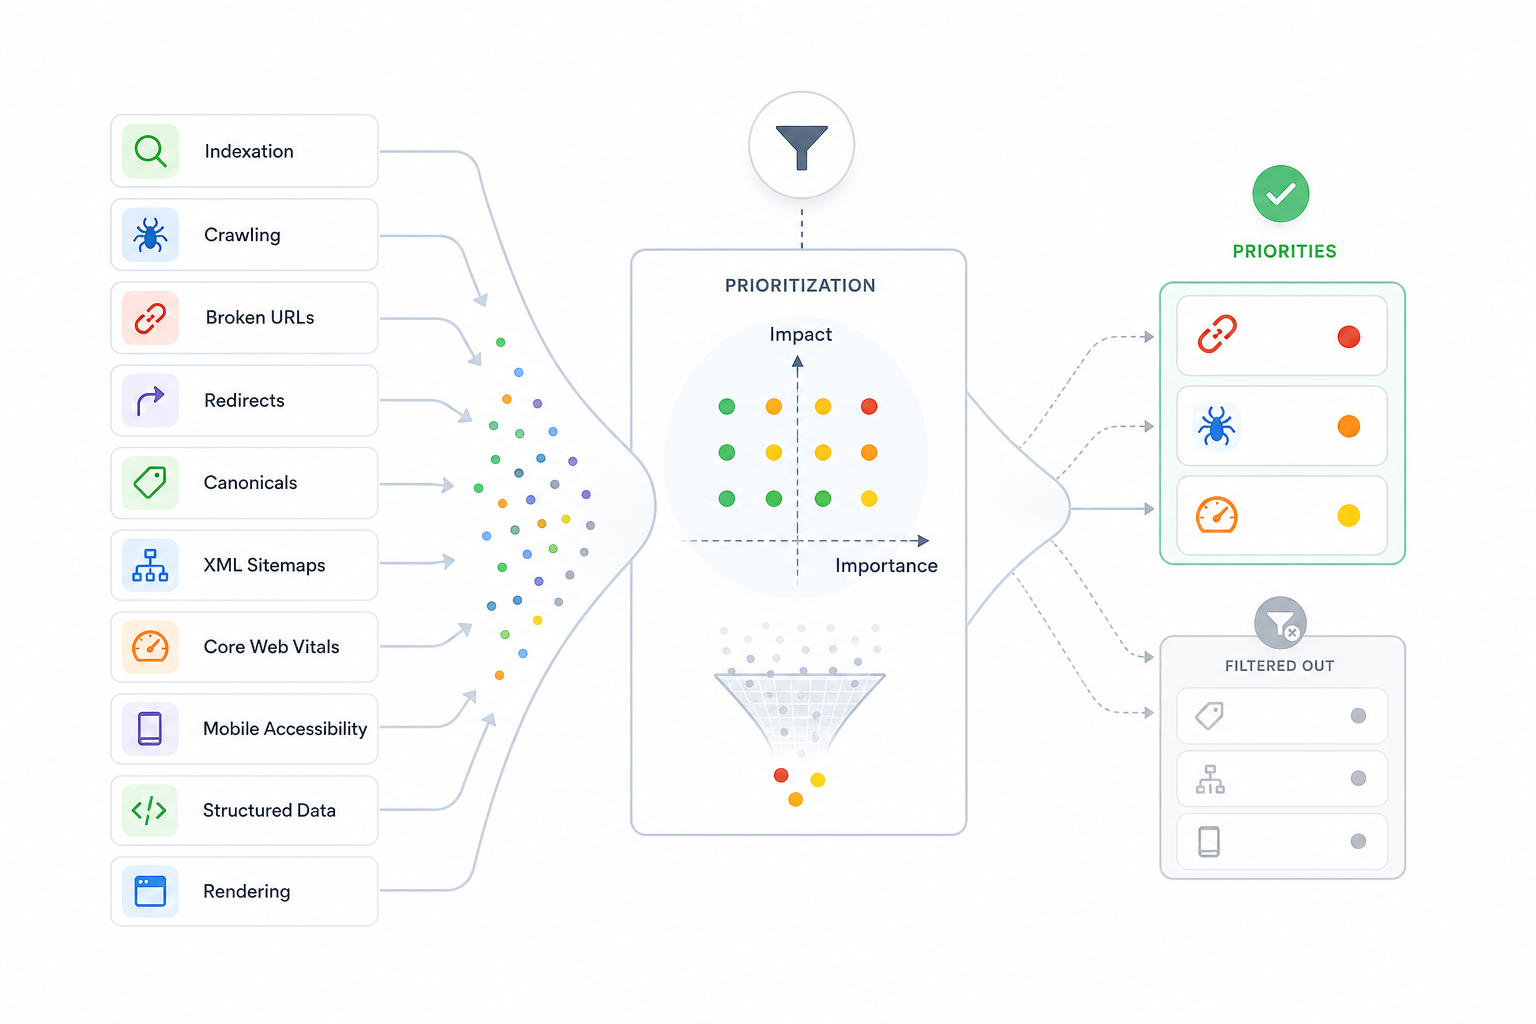
Show only important findings.
Example:
- 430 duplicate URLs removed from indexable crawl paths
- Sitemap canonical consistency improved
- One template-level Core Web Vitals issue remains unresolved
Technical reporting should focus on material conditions rather than every audit warning.
Work Completed
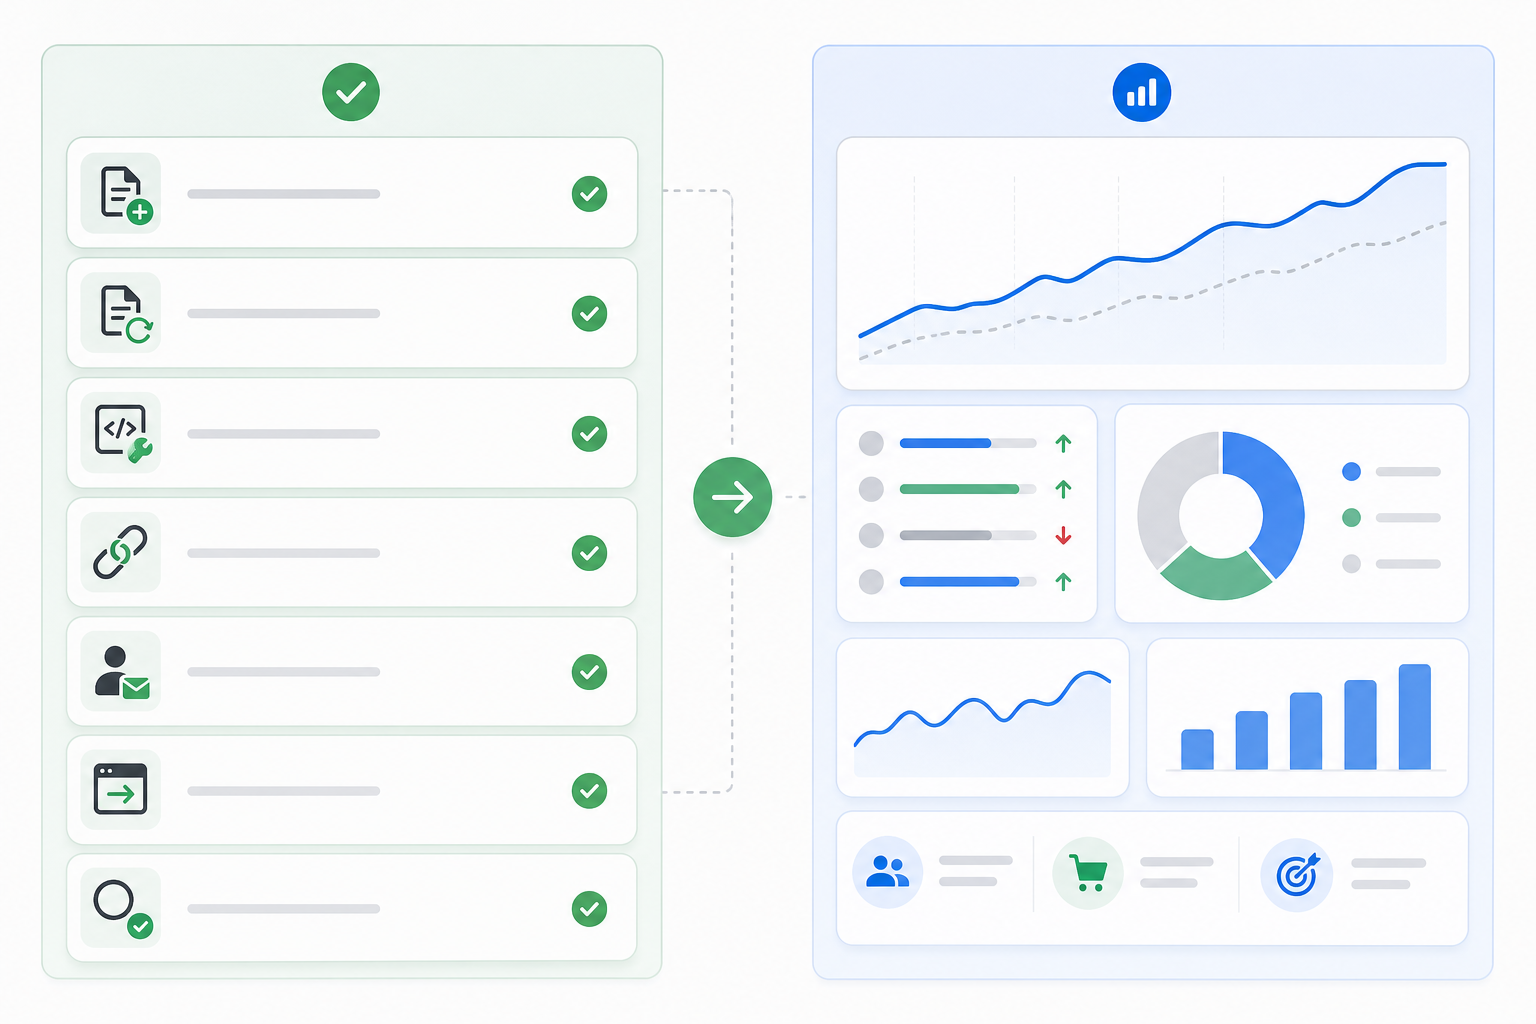
Example:
- 6 priority pages refreshed
- 3 new commercial pages published
- 48 contextual internal links added
- Duplicate URL issue resolved
- 8 new referring domains acquired
Keep completed activity separate from results.
Key Insights
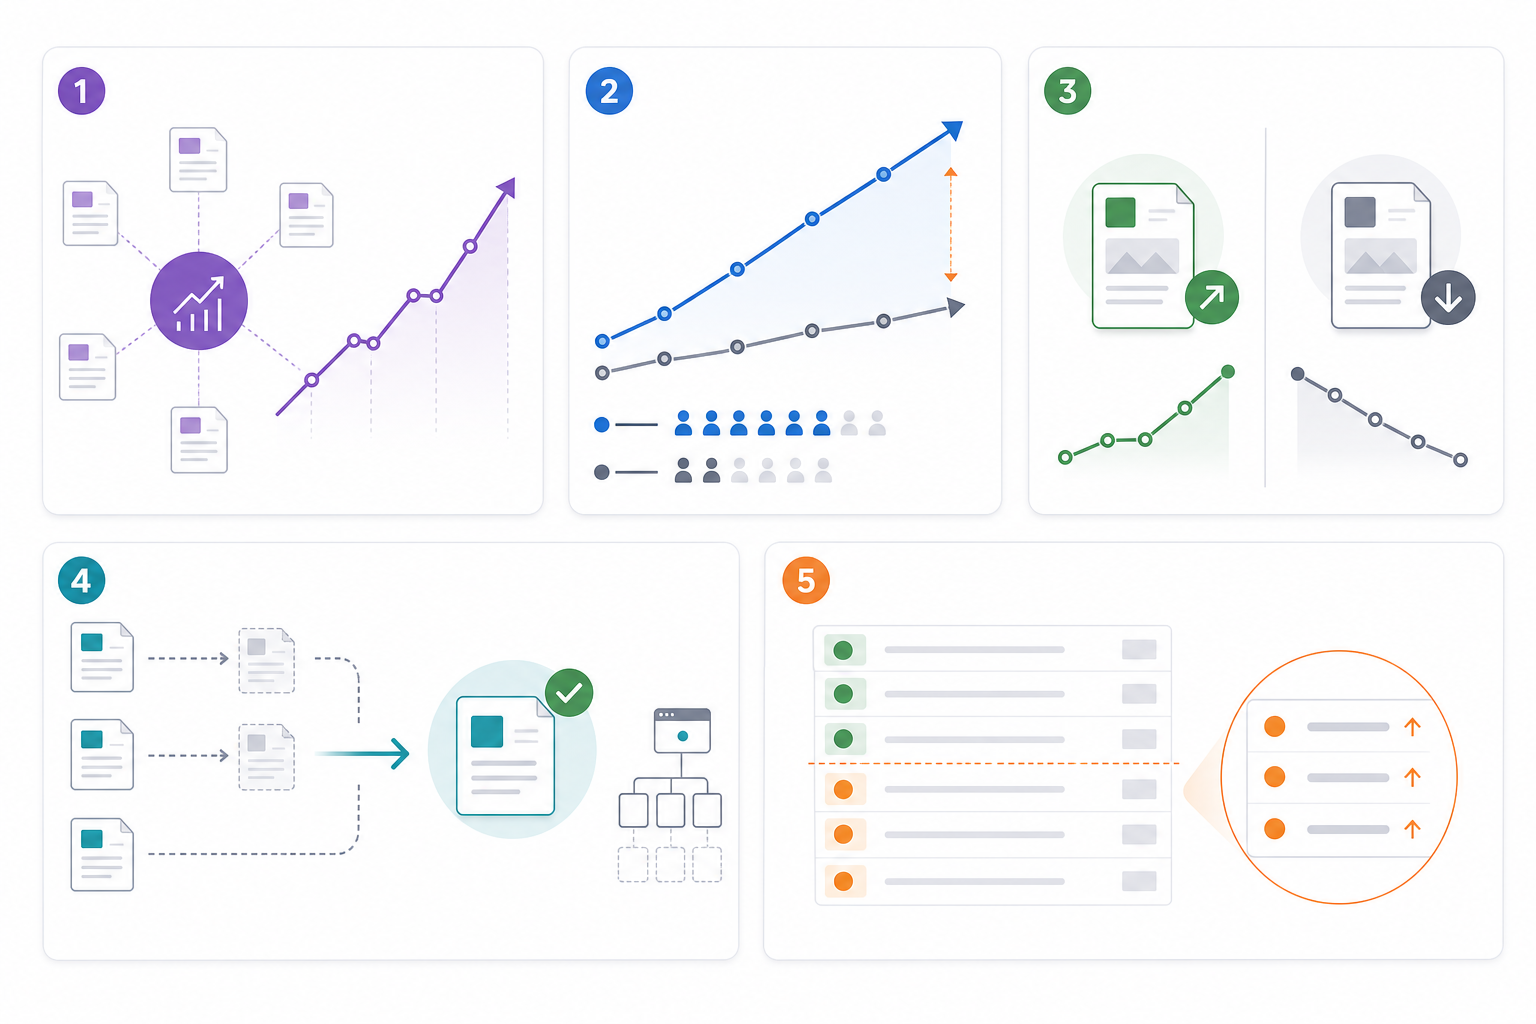
A useful report can summarize three to five important conclusions:
- Organic visibility expanded across the priority topic cluster.
- Traffic growth exceeded lead growth, creating a conversion optimization opportunity.
- Refreshed pages generated stronger click growth than unchanged declining pages.
- Duplicate URL cleanup improved technical consistency.
- Several commercially relevant queries remain outside the Top 10.
Priority Actions for the Next Period
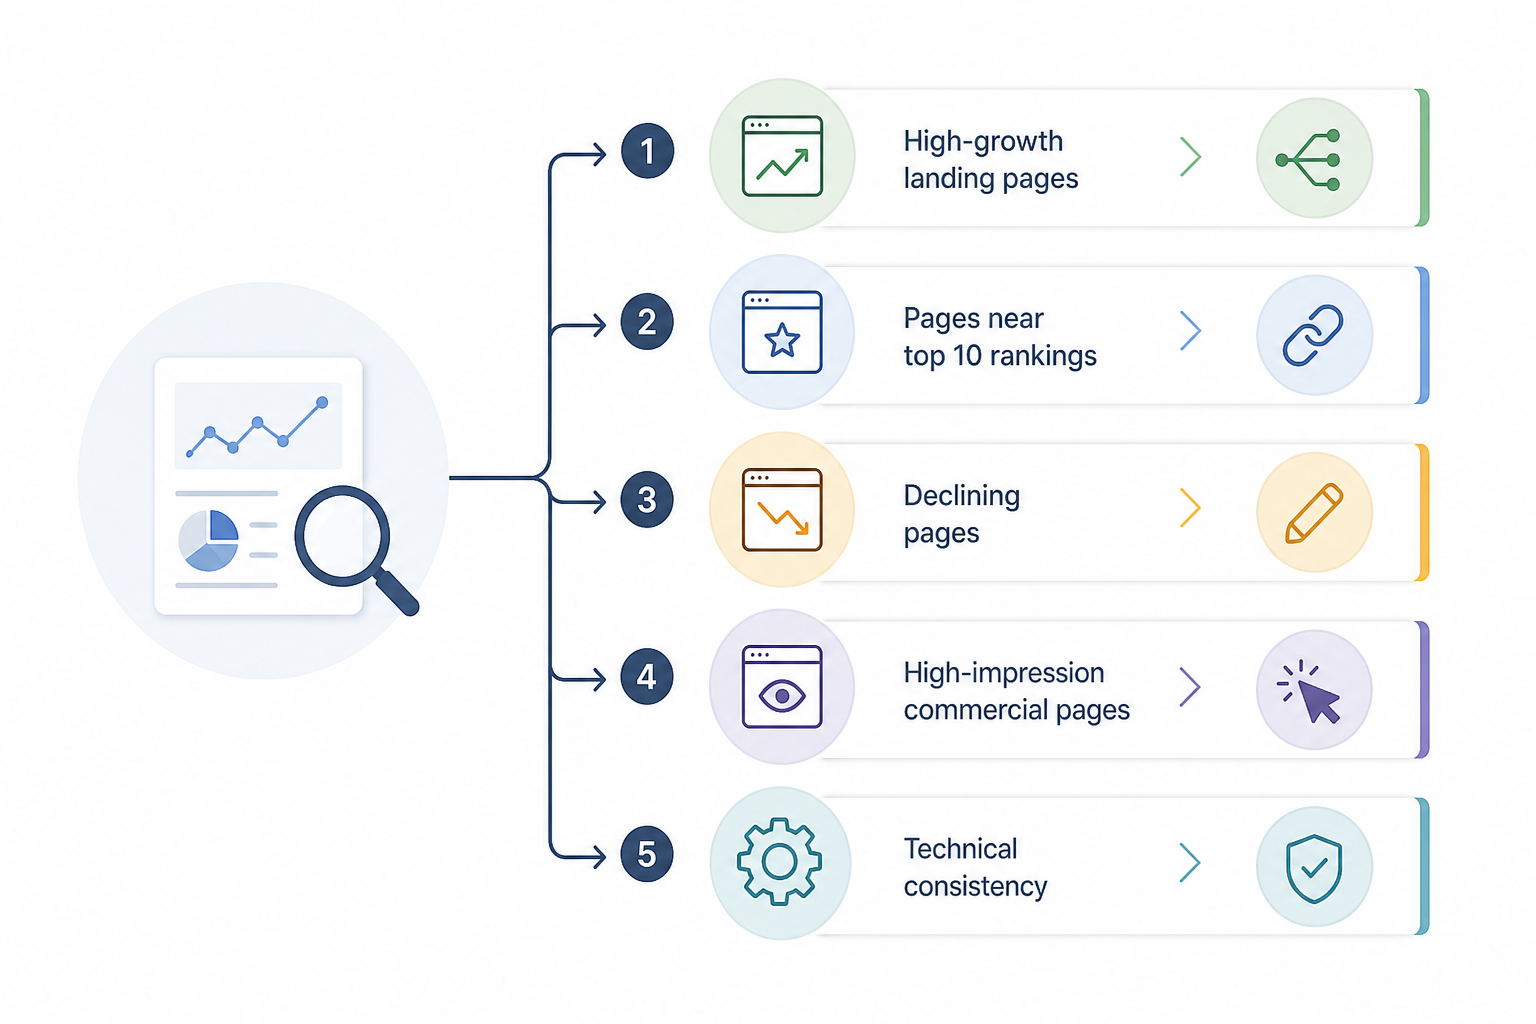
Examples:
- Improve conversion paths on high-growth landing pages.
- Strengthen internal links to pages approaching Top 10 positions.
- Refresh declining pages with outdated or incomplete information.
- Investigate CTR on high-impression commercial pages.
- Continue monitoring canonical and indexation consistency.
A good SEO report example makes the performance story understandable even to stakeholders who do not work in SEO every day.
How Do You Create an Effective SEO Report?
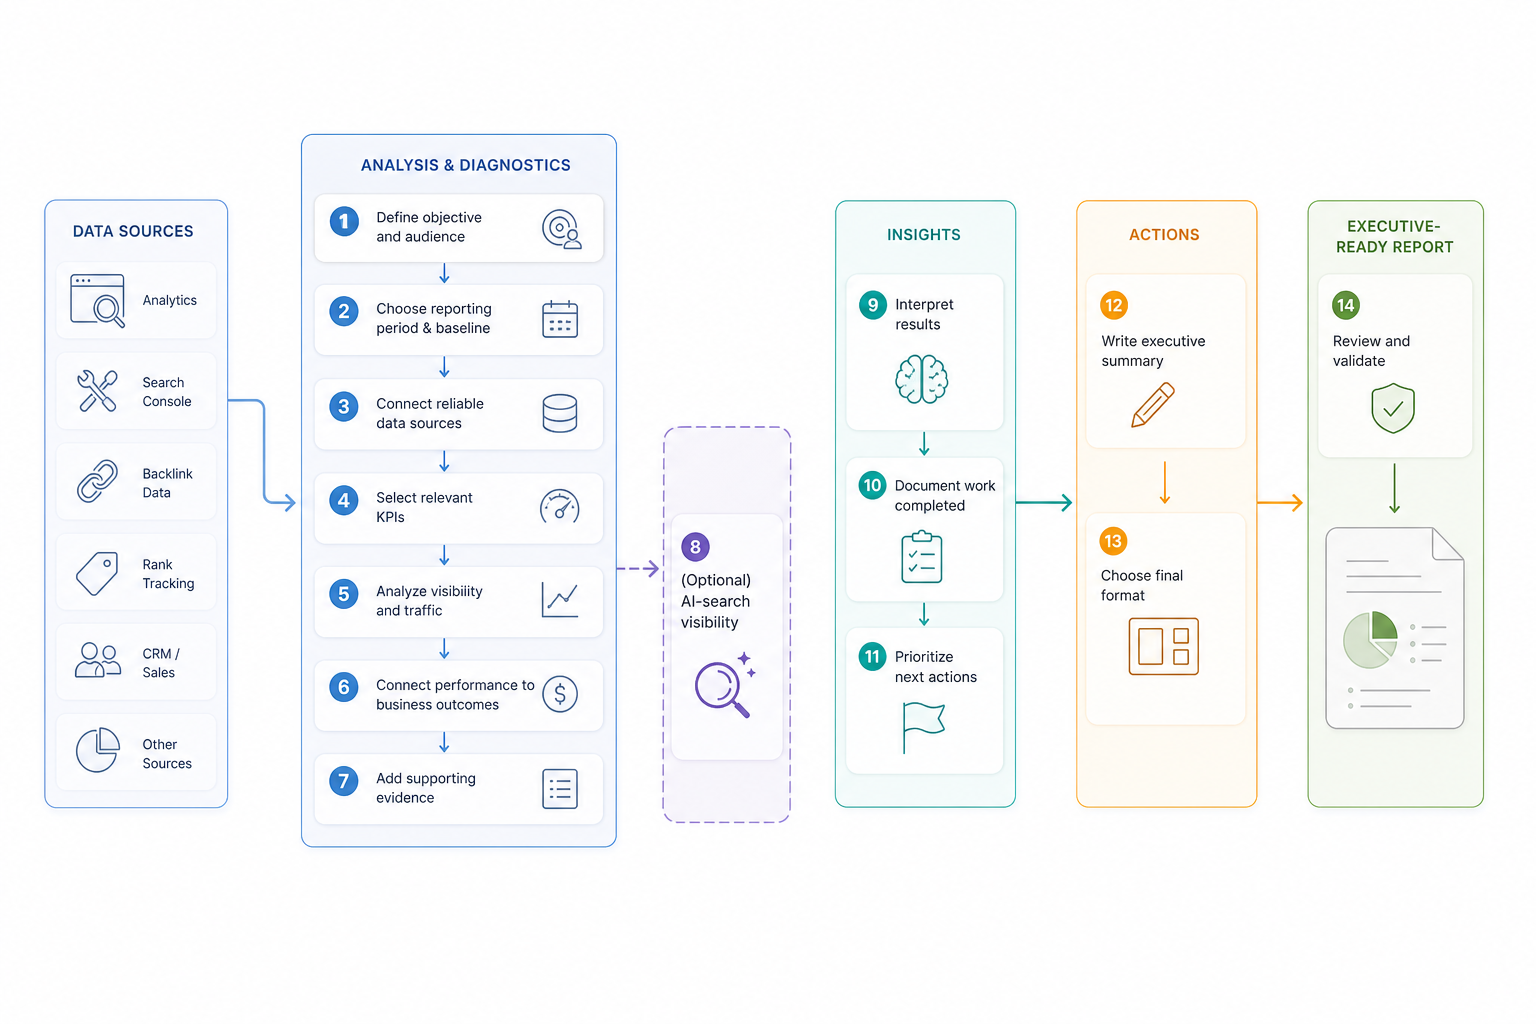
An effective SEO report is created by defining the reporting objective, collecting reliable data, selecting meaningful KPIs, analyzing performance, interpreting the findings, and converting those findings into clear priorities.
1. Define the Reporting Objective and Audience
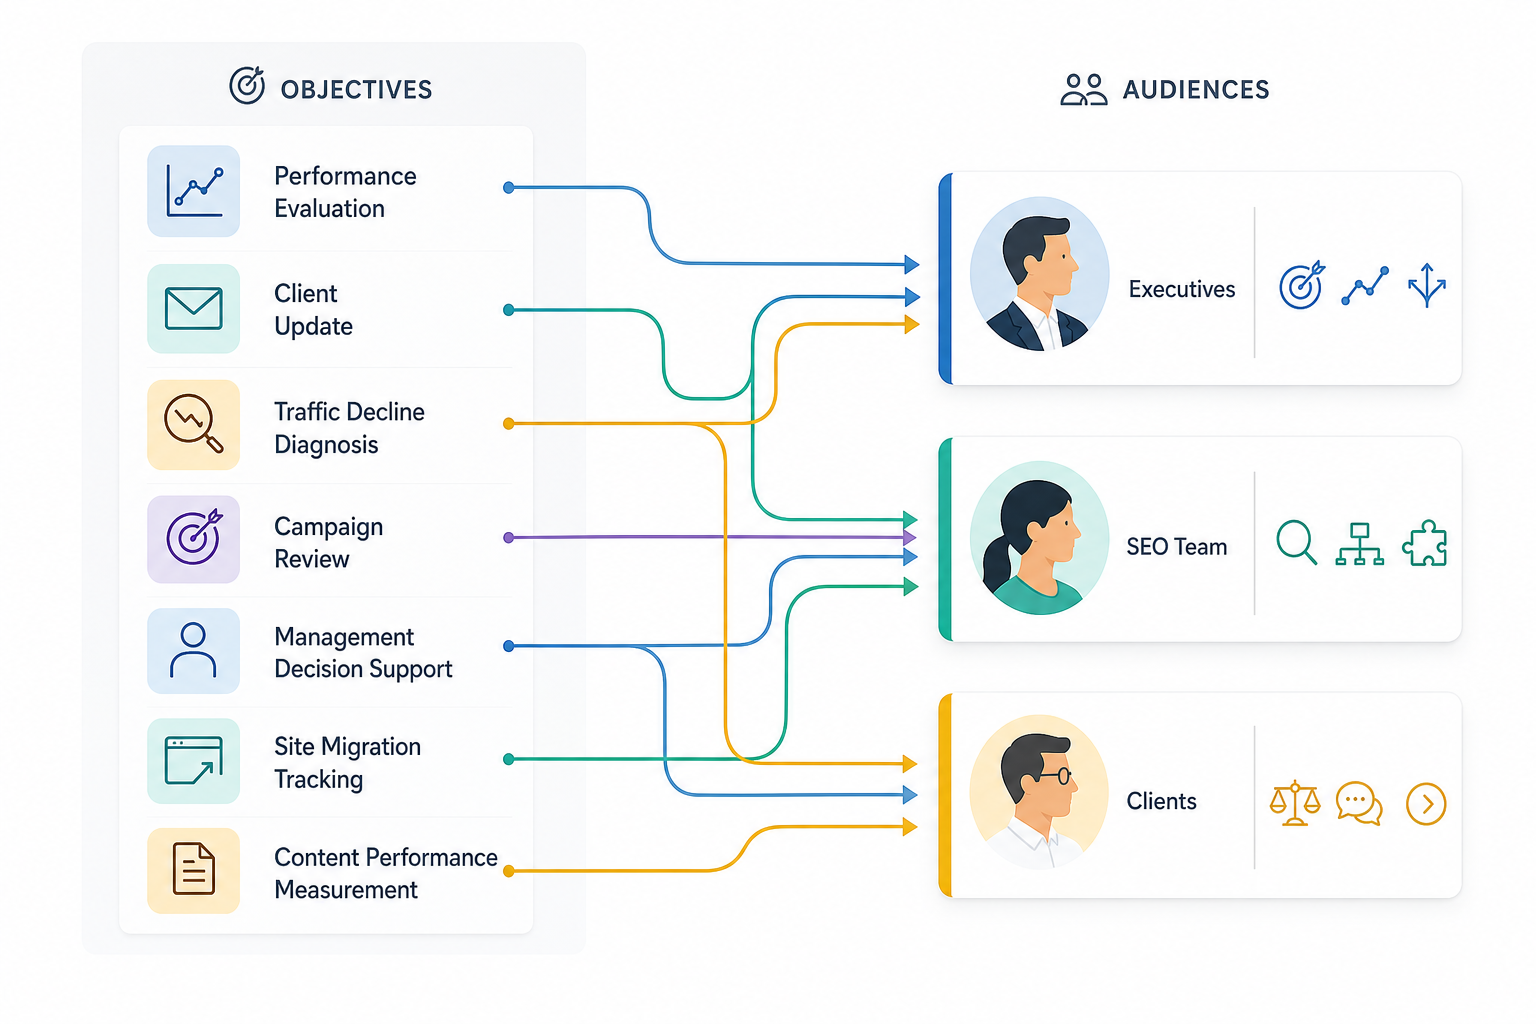
Determine why the report exists.
Common objectives include:
- Evaluate SEO performance
- Update a client
- Diagnose a decline
- Review a campaign
- Support management decisions
- Track a migration
- Measure content performance
Identify the intended audience.
Executives need business outcomes and decisions. SEO teams require deeper diagnostic information. Clients usually need a balance of performance, accountability, explanation, and next steps.
2. Select the Reporting Period and Baseline
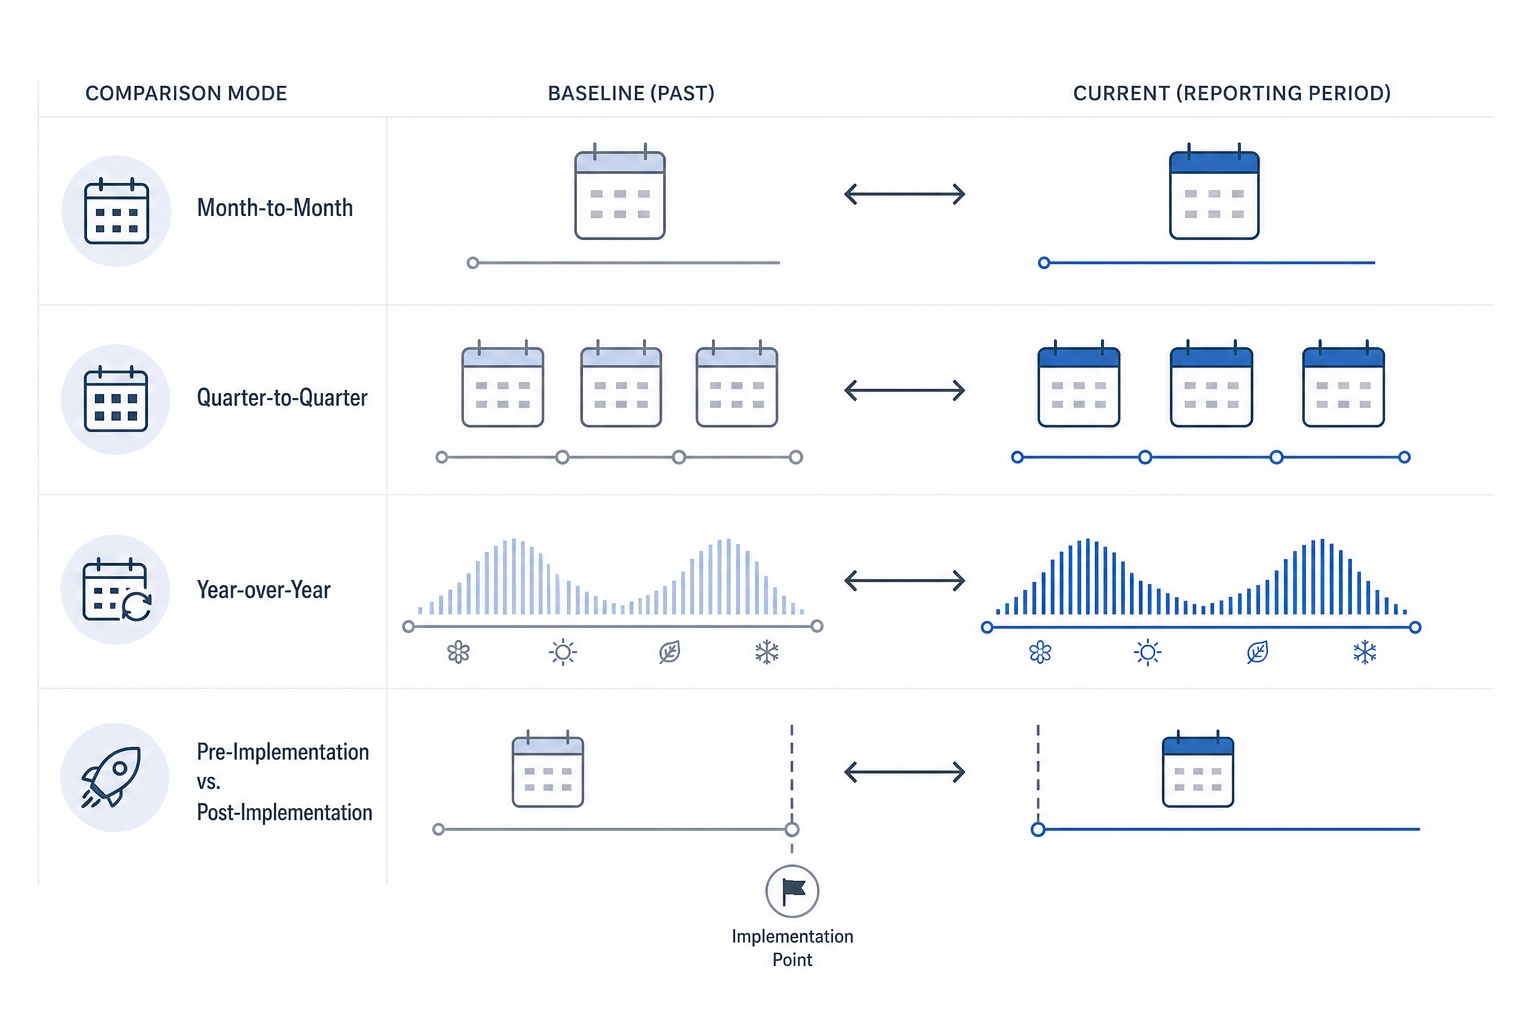
Choose the period being reported.
Examples include:
- Monthly
- Quarterly
- Year over year
- Pre-implementation versus post-implementation
Use a clearly defined comparison period.
Seasonal businesses often benefit from year-over-year comparisons alongside shorter-term movement.
3. Connect Reliable Data Sources
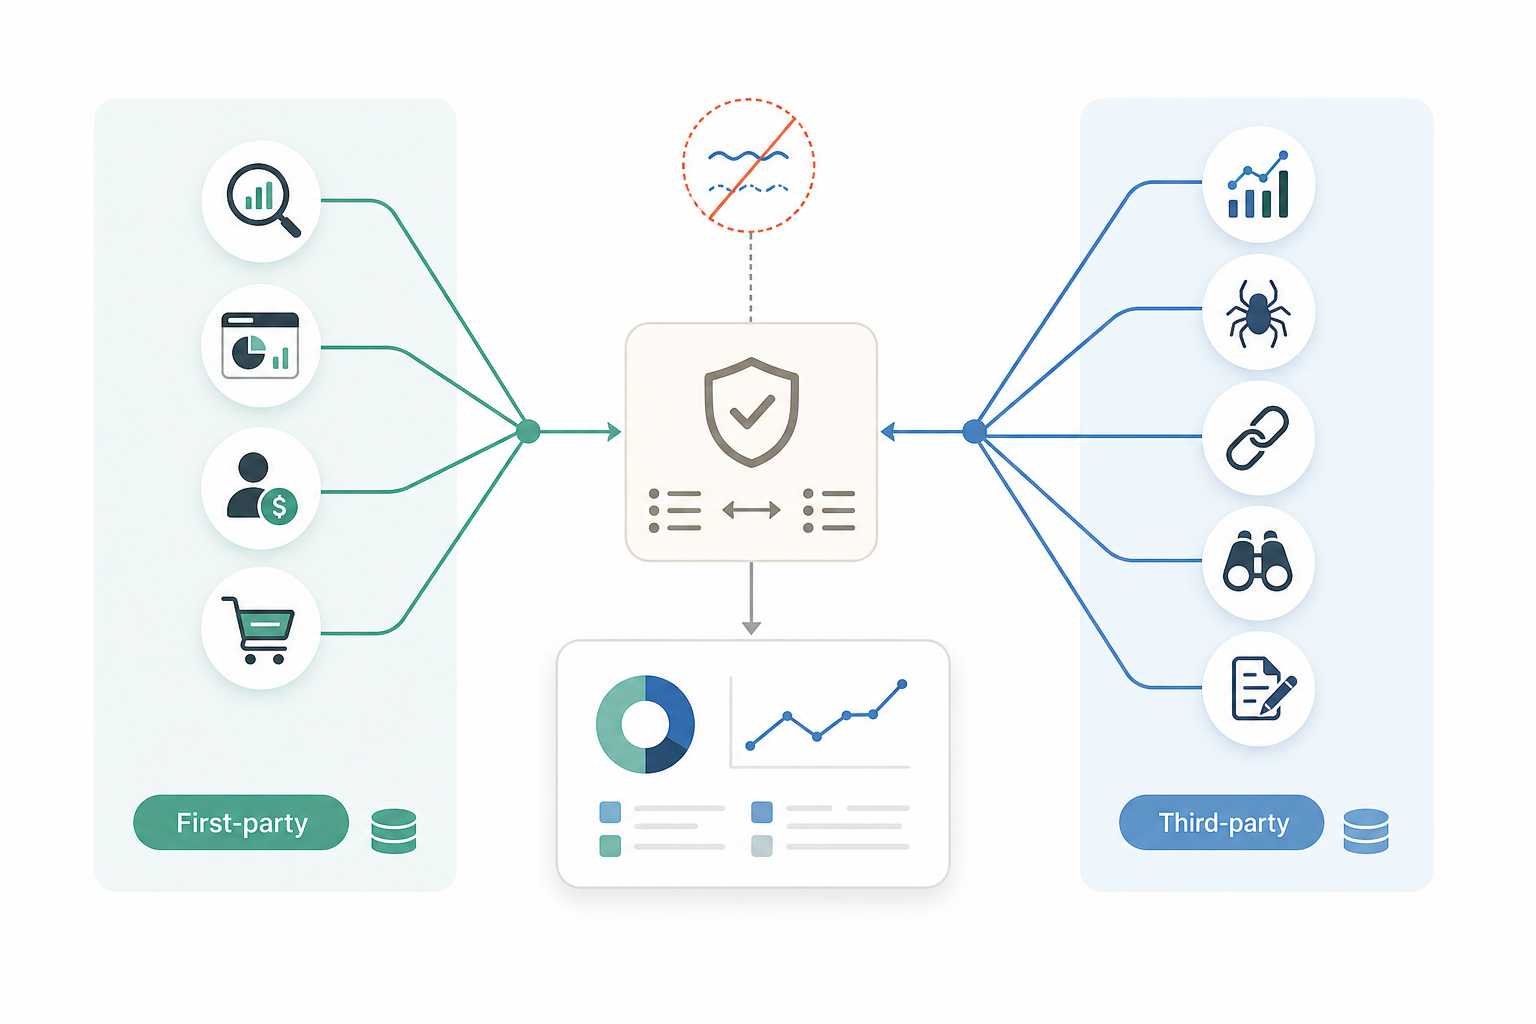
Use first-party data wherever available.
Common sources include:
- Google Search Console
- Google Analytics
- CRM or revenue systems
- Ecommerce platforms
Add supporting sources where necessary:
- Rank trackers
- Crawlers
- Backlink platforms
- Competitor tools
- Content platforms
Understand differences between datasets before combining them.
Third-party traffic estimates do not represent the same thing as first-party analytics data.
4. Select Relevant KPIs
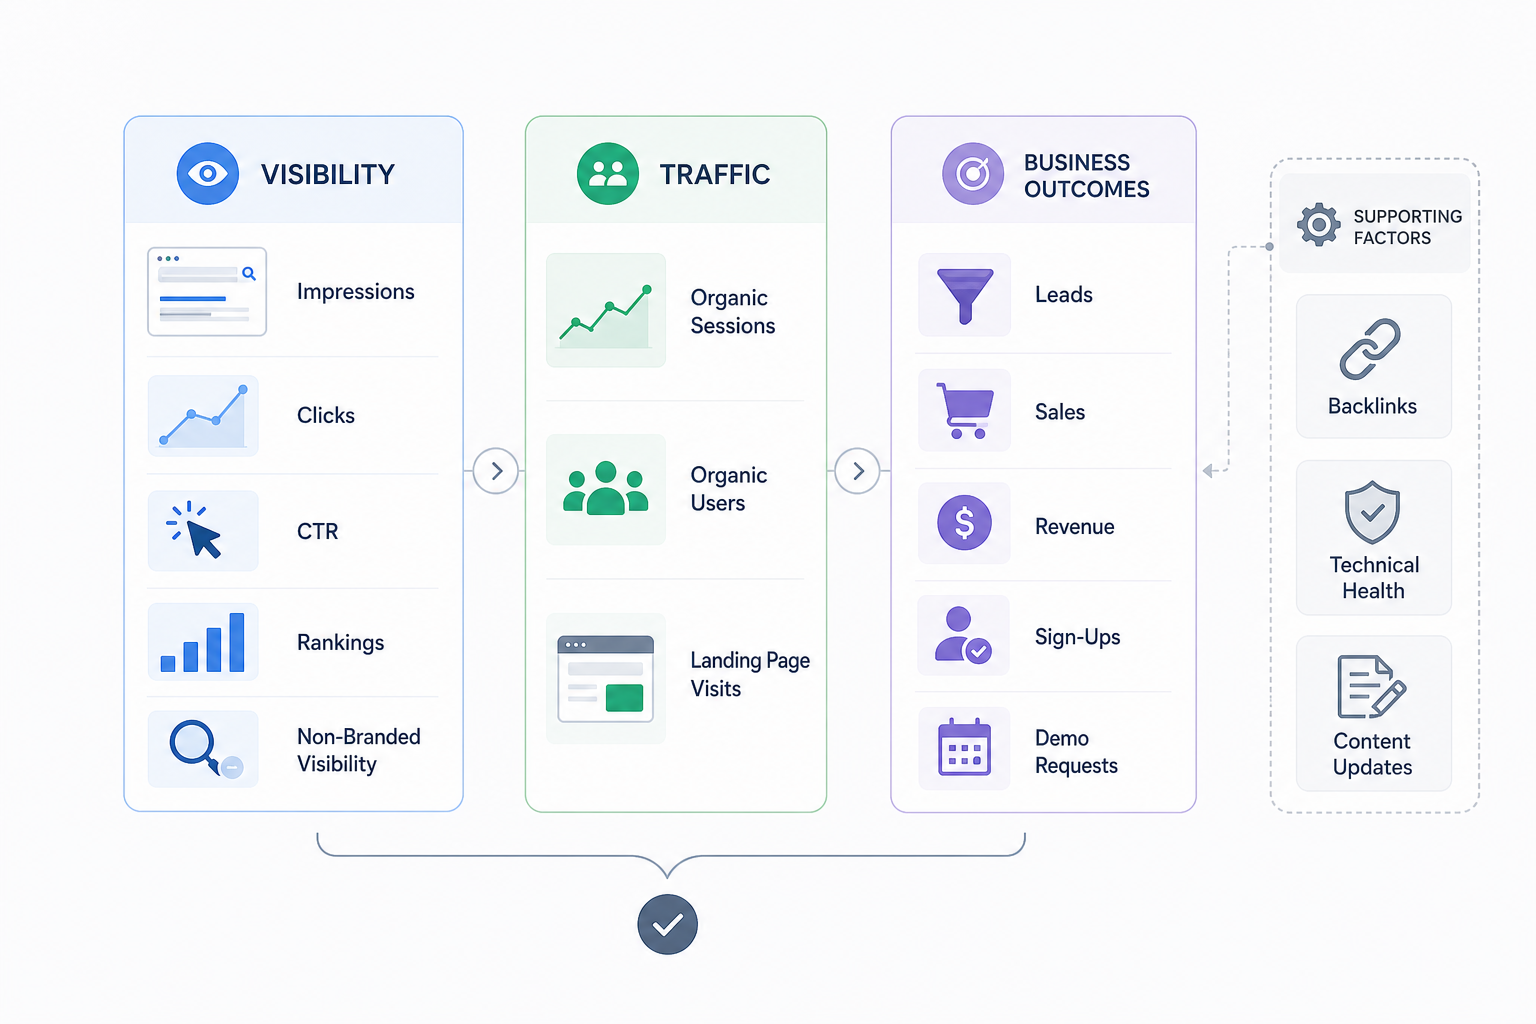
Choose metrics according to the reporting goal.
Potential visibility indicators include:
- Impressions
- Clicks
- CTR
- Rankings
- Non-branded visibility
Traffic metrics can include:
- Organic sessions
- Organic users
- Landing-page visits
Business outcomes can include:
- Leads
- Sales
- Revenue
- Sign-ups
- Demo requests
Supporting metrics such as backlinks, technical health, and content updates belong in the report when they help explain performance.
5. Analyze Organic Visibility and Traffic
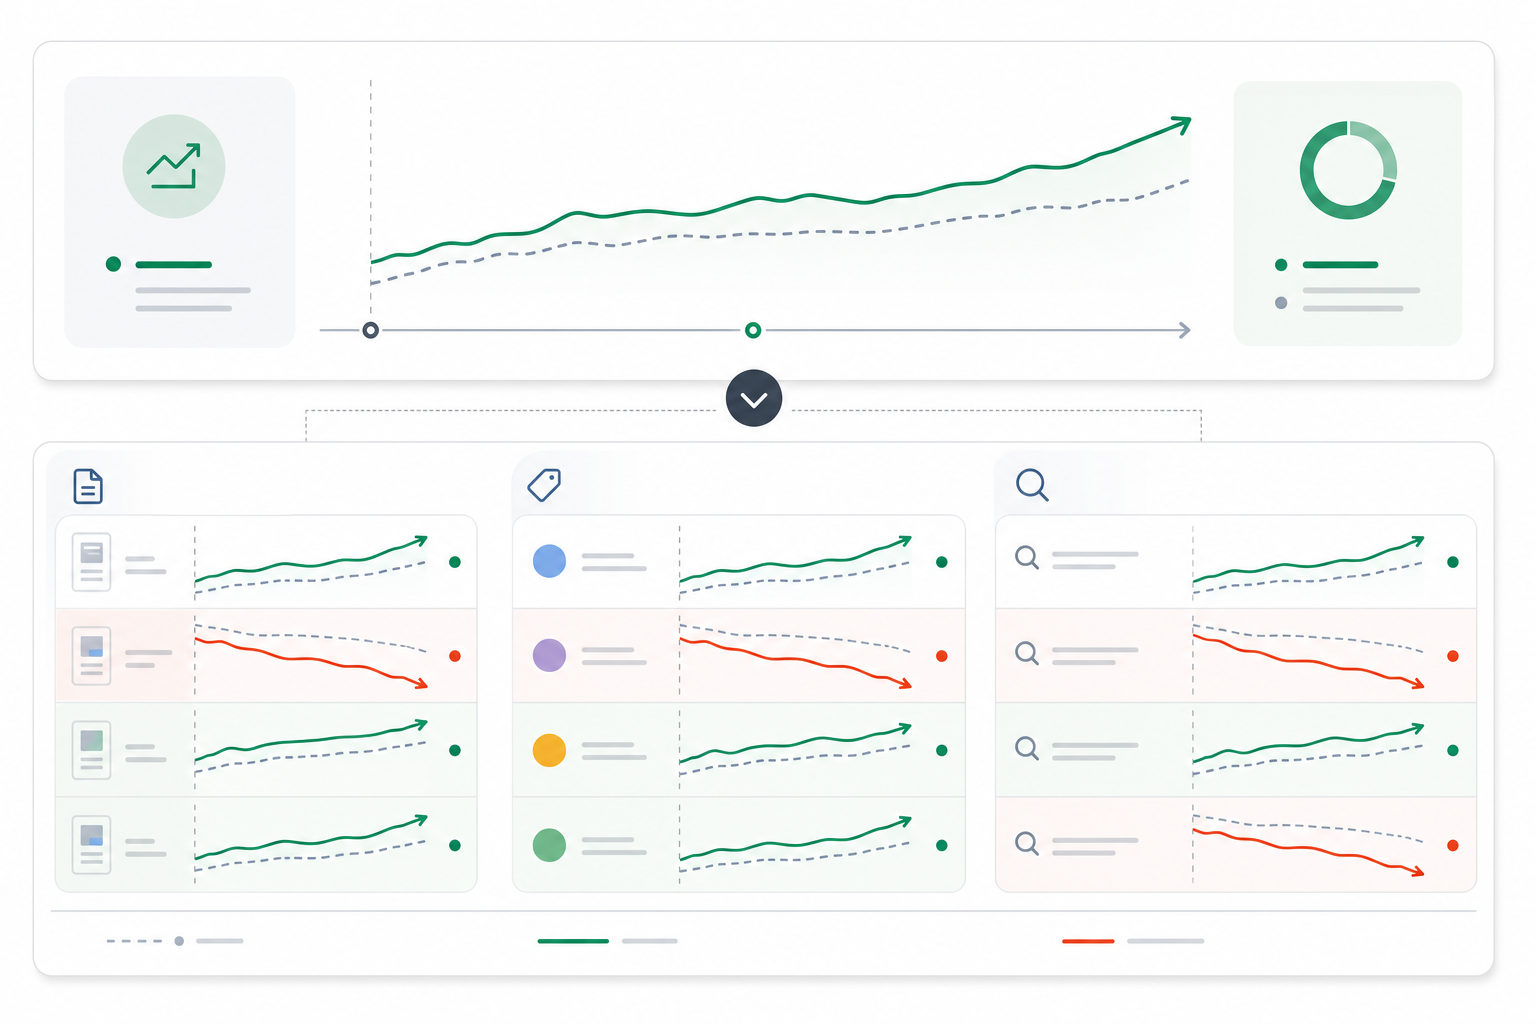
Compare the current period with the selected baseline.
Look for:
- Major gains
- Important declines
- Emerging patterns
- Anomalies
- Changes by page
- Changes by topic
- Changes by query
Avoid relying on aggregate totals alone.
A sitewide increase can hide a decline in the website’s highest-value commercial section.
6. Connect SEO Performance With Business Outcomes
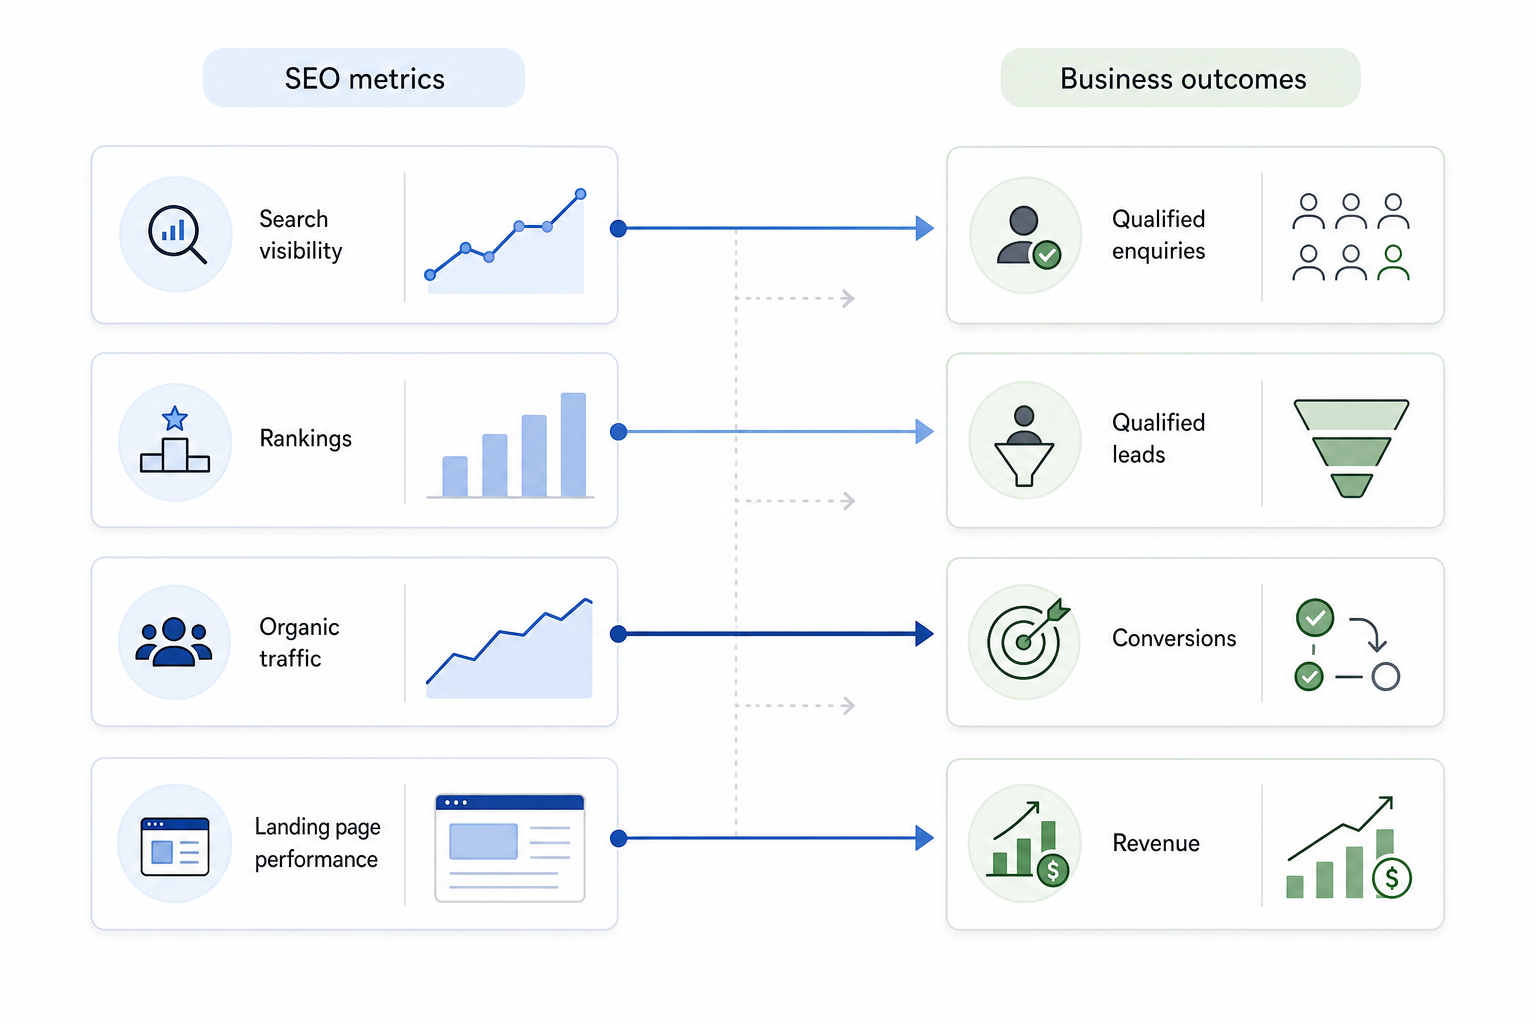
Determine whether stronger visibility and traffic contribute to meaningful business results.
Compare:
- Traffic with leads
- Landing pages with conversions
- Search growth with revenue
- Visibility with qualified enquiries
Keep visibility metrics and outcome metrics distinct.
A ranking improvement is an early indicator. A qualified lead is a business outcome.
7. Add Supporting SEO Evidence
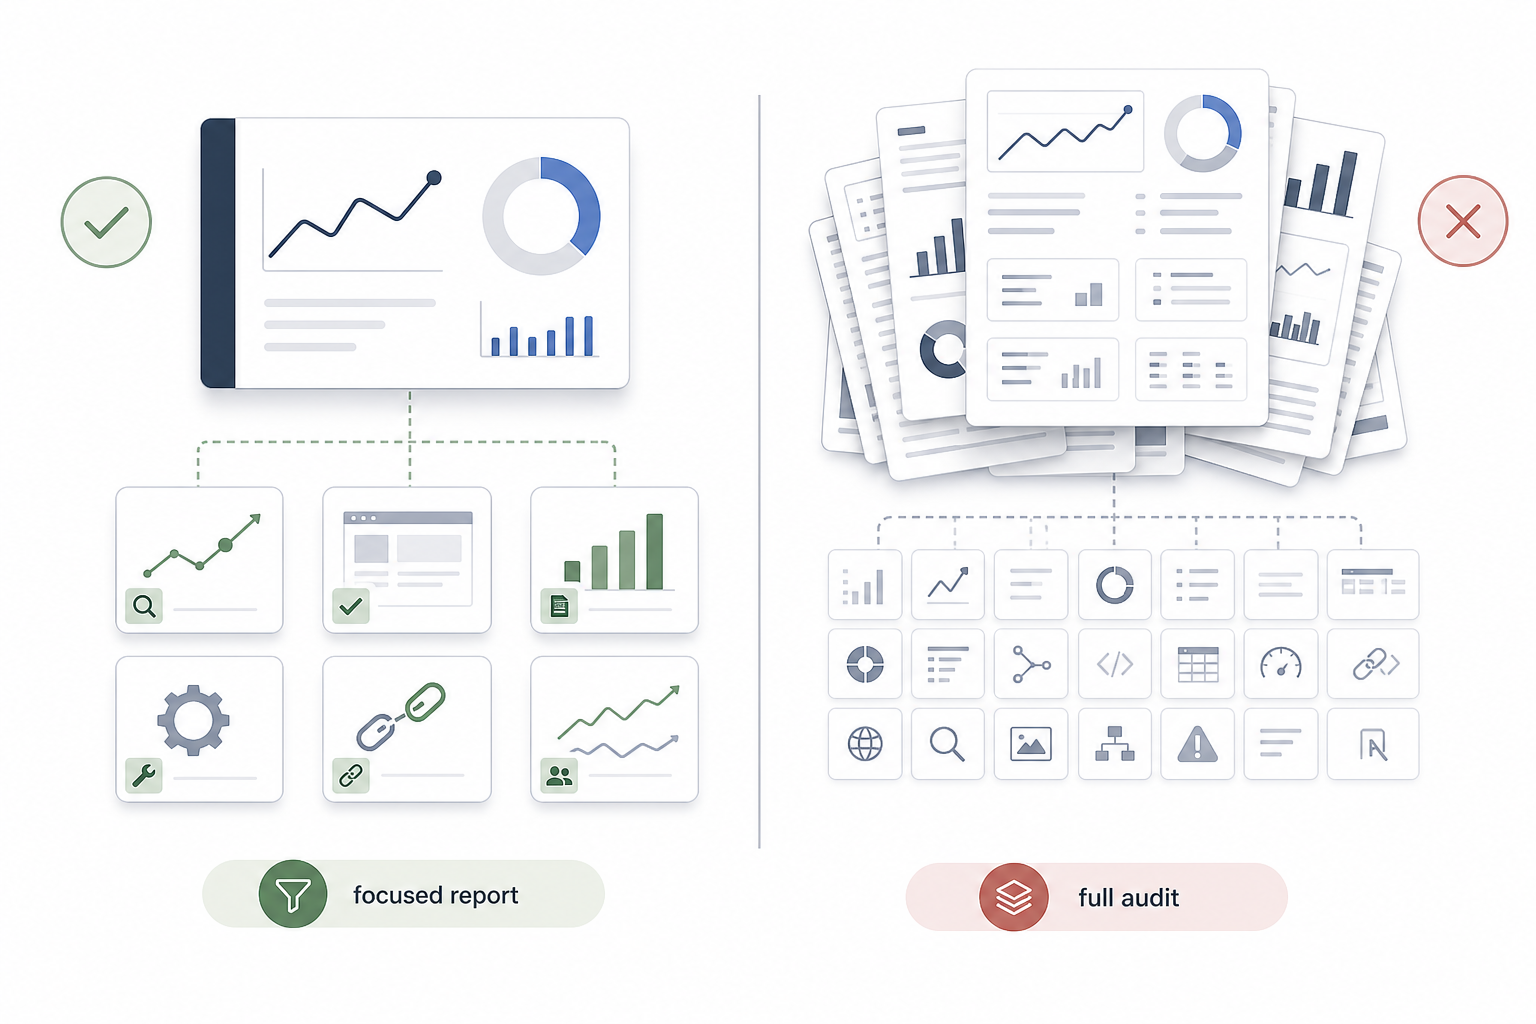
Include deeper evidence only where it helps explain performance.
This can include:
- Keyword movement
- Landing-page results
- Content performance
- Technical changes
- Backlink changes
- Competitor movement
Do not turn every monthly report into a complete SEO audit.
8. Include AI-Search Visibility Where Relevant
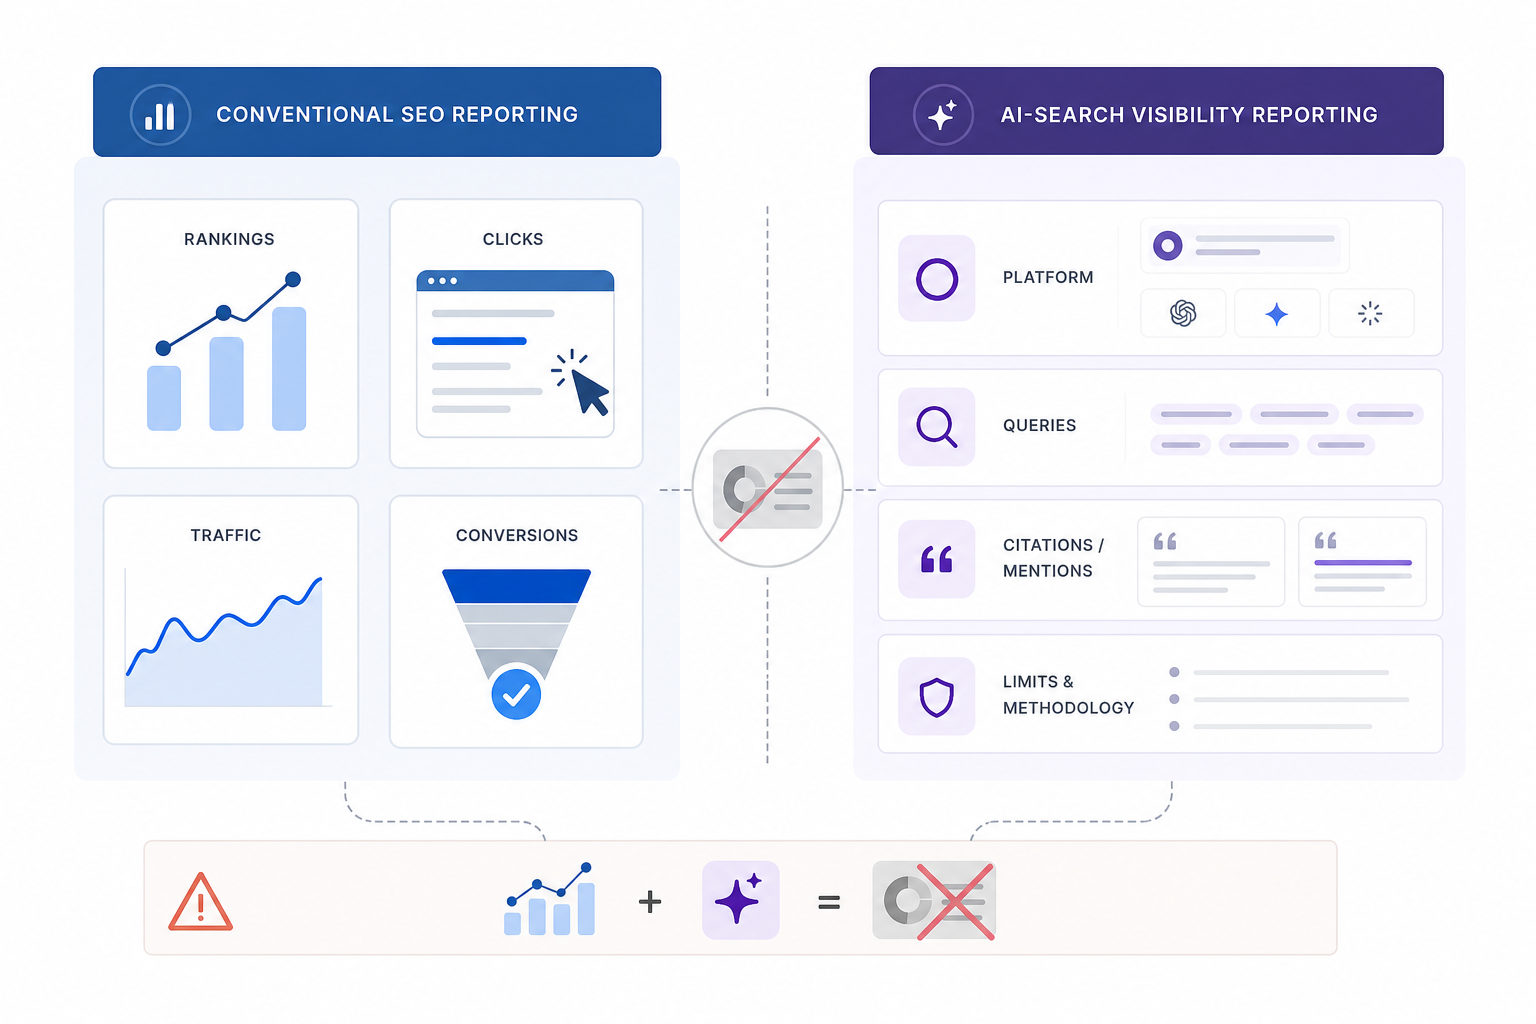
If the organization actively tracks visibility across AI-assisted search environments, report it separately.
Clearly document:
- Platform
- Query set
- Mention or citation methodology
- Measurement limitations
Do not merge AI visibility with conventional rankings, clicks, traffic, or conversions into one generic score.
9. Interpret the Results
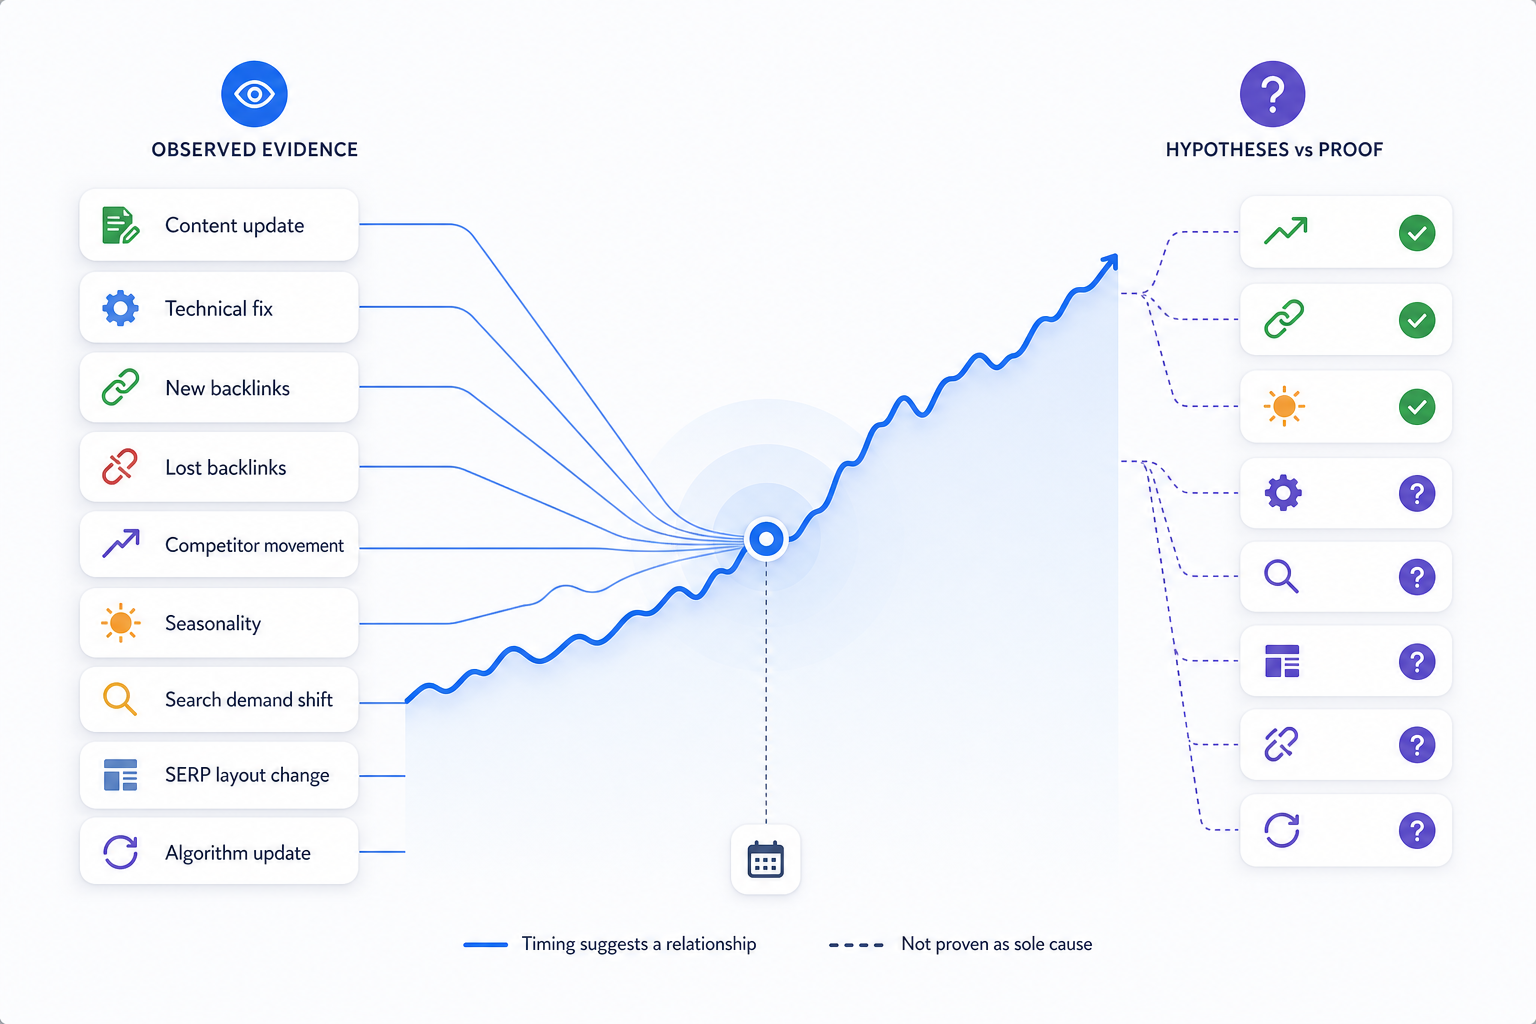
Explain the most meaningful movements.
Potential influences can include:
- Content updates
- Technical changes
- New links
- Lost links
- Competitor growth
- Seasonality
- Search-demand changes
- SERP changes
- Algorithm changes
Separate confirmed evidence from hypotheses.
If a page gained traffic after an update, the timing supports a relationship but does not automatically prove that the update alone caused the increase.
10. Document Work Completed
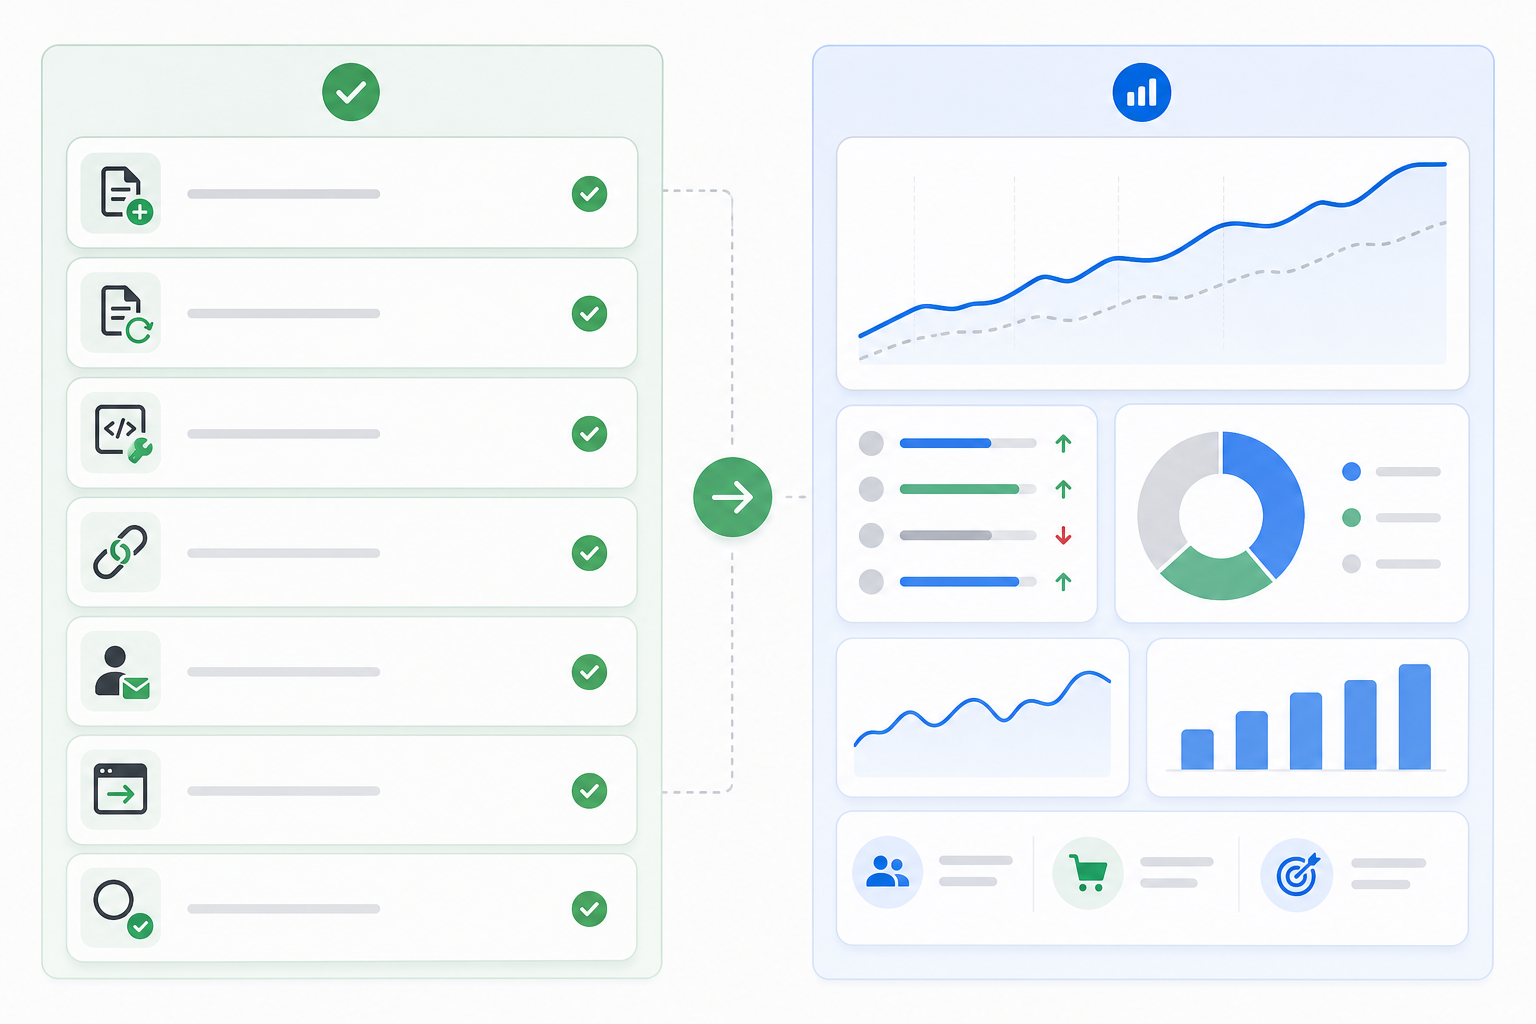
Summarize significant SEO activity.
Examples include:
- Pages published
- Pages refreshed
- Technical fixes
- Internal links
- Backlink work
- Migration tasks
- Page optimizations
Keep delivery and performance results separate.
11. Prioritize Next Actions
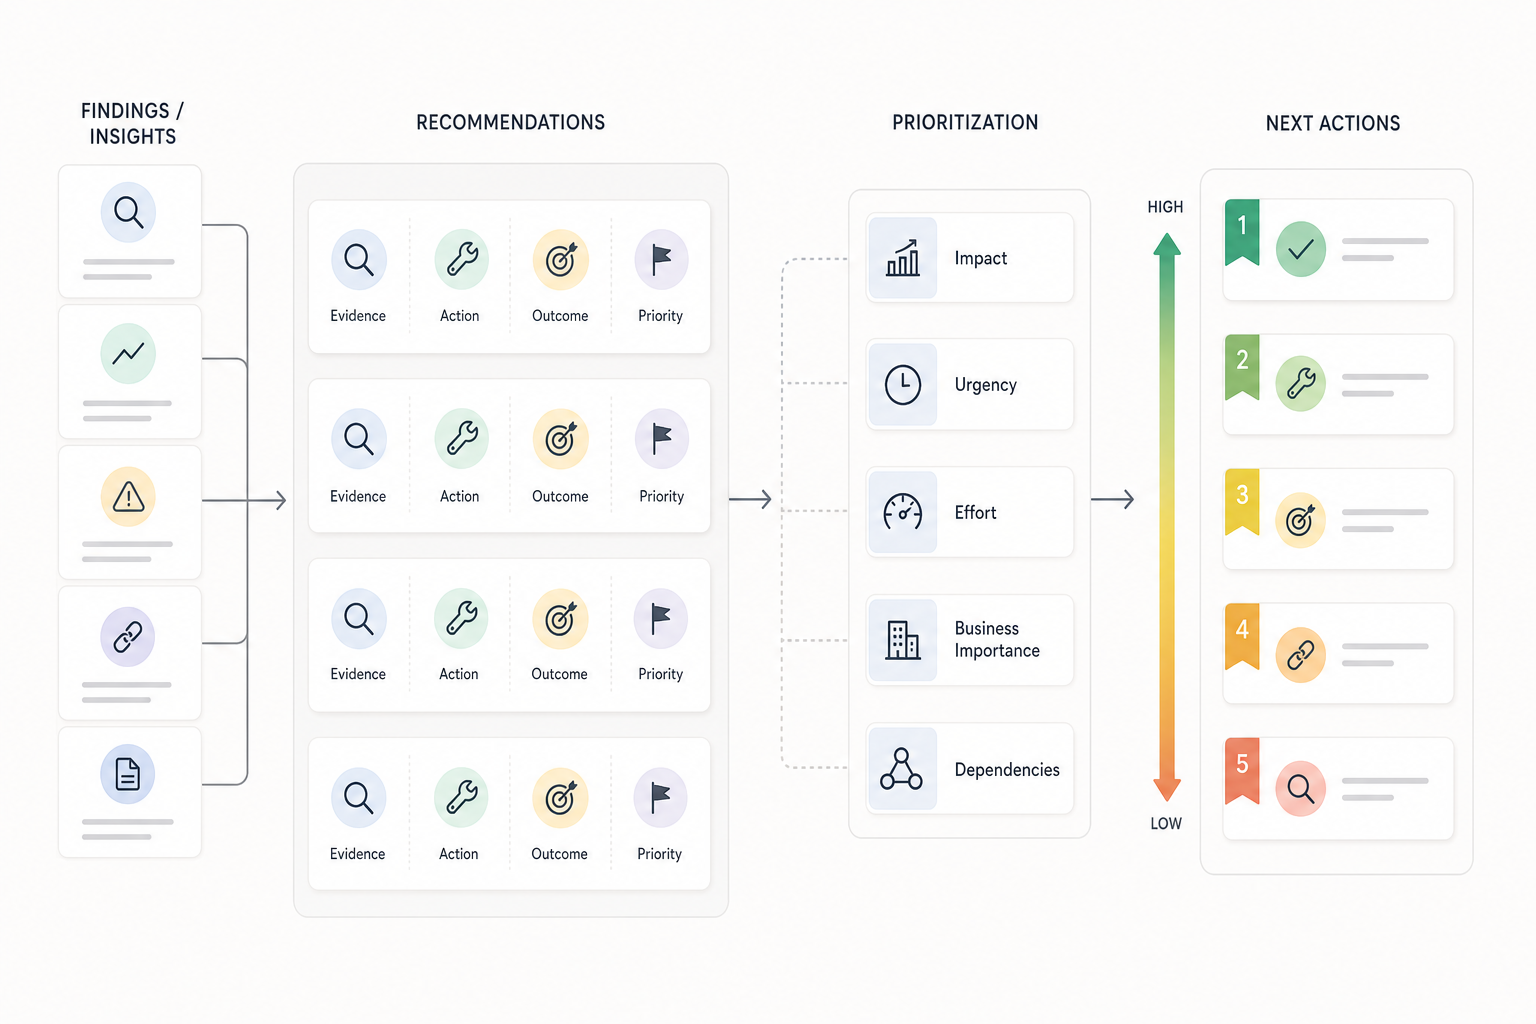
Convert the findings into recommendations.
Each recommendation needs:
- Supporting evidence
- Specific action
- Intended outcome
- Priority
Consider:
- Impact
- Urgency
- Effort
- Business importance
- Dependencies
12. Write the Executive Summary
Write the summary after completing the analysis.
Include:
- Largest performance change
- Most important business outcome
- Main win
- Primary concern
- Immediate priority
Place the finished summary at the beginning of the report.
13. Choose the Final Reporting Format
Select the format according to the audience.
Use:
- Dashboards for recurring monitoring
- Presentations for stakeholder review meetings
- PDFs for fixed reports
- Spreadsheets for operational detail
- Documents for deeper written analysis
Combine formats where useful.
14. Review the Report
Validate:
- Date ranges
- Comparison periods
- Filters
- Metric definitions
- Charts
- Calculations
- Conversion tracking
- Written conclusions
Remove:
- Redundant metrics
- Unsupported claims
- Unexplained charts
- Technical details that do not inform a decision
An effective report turns reliable SEO data into a clear explanation of performance and a practical plan for what happens next.
How Do You Create an SEO Analysis Report?
An SEO analysis report uses website and search-performance data to diagnose what is limiting organic performance, quantify the issue, and recommend prioritized changes.
It is more diagnostic than a standard recurring report. That diagnostic focus makes the report the documented output of a broader SEO analysis, where performance data is investigated to identify constraints, causes, and optimization priorities.
1. Define the Analysis Objective
Establish the problem being investigated.
Examples include:
- Traffic decline
- Ranking loss
- Poor indexation
- Overall SEO condition
- New website assessment
- Growth opportunity analysis
Keep the scope specific.
2. Establish the Baseline
Choose:
- Historical comparison
- Current reporting period
- Competitor set
- Pre/post period
- Relevant benchmark
Use the same basis consistently.
3. Gather First-Party Data
Use Search Console for:
- Clicks
- Impressions
- Queries
- CTR
- Landing-page visibility
- Index-related information
Use analytics for:
- Sessions
- Users
- Landing pages
- Engagement
- Conversions
4. Gather Supporting SEO Data
Use additional data where the diagnostic question requires it.
This can include:
- Crawl data
- Rankings
- Backlinks
- Competitor visibility
- Technical findings
- Content data
5. Analyze Visibility and Traffic
Break performance into meaningful segments.
Review:
- Pages
- Queries
- Topics
- Directories
- Countries
- Devices
Look for patterns rather than reporting only aggregate movement.
6. Analyze Keyword and Search-Intent Performance
Review:
- Target queries
- Ranking changes
- Search intent
- Weak targeting
- Keyword gaps
- Cannibalization
- Unintended query associations
7. Analyze Content and On-Page Conditions
Review relevant pages for:
- Relevance
- Topic coverage
- Metadata
- Headings
- Internal links
- Freshness
- Page-level optimization
Connect every finding with a specific URL or group of URLs.
8. Analyze Technical SEO Conditions
Where relevant, review:
- Crawlability
- Indexability
- Rendering
- Status codes
- Redirects
- Canonicals
- XML sitemaps
- Performance
- Mobile behavior
- Structured data
Prioritize by actual impact rather than tool severity.
9. Analyze Authority Where Relevant
Review:
- Referring domains
- Link gains
- Link losses
- Important backlinks
- Competitor link gaps
Do not make backlinks a major section when they have little relevance to the diagnostic question.
10. Analyze Competitor Gaps
Compare relevant competitors using:
- Keywords
- Content coverage
- Rankings
- Backlinks
- Visibility
Use competitor evidence to identify opportunities, not templates to copy.
11. Include AI Visibility Where Relevant
Where AI-search visibility is part of the analysis, document:
- Platforms
- Queries
- Mentions or citations
- Methodology
- Limitations
Keep it separate from traditional search metrics.
12. Convert Observations Into Findings
For each important issue, state:
- Finding
- Evidence
- Affected area
- Likely impact
Separate symptoms from root causes.
13. Prioritize the Findings
Evaluate:
- SEO impact
- Business value
- Scale
- Urgency
- Confidence
- Effort
- Dependencies
Separate critical blockers from lower-value improvements.
14. Write Actionable Recommendations
Turn each finding into a specific action.
Avoid vague recommendations such as:
“Improve SEO.”
Instead state what page, system, or area requires change and what objective the change serves.
15. Write the Executive Summary
Summarize:
- Main findings
- Largest opportunities
- Key risks
- Highest-priority actions
Write this after the analysis is complete.
16. Present the Action Plan
A useful findings table can look like this:
| SEO Area | Finding | Evidence | Impact | Recommended Action | Priority |
|---|---|---|---|---|---|
| Technical | Important pages excluded | Indexation evidence | High | Correct indexation configuration | High |
| Content | Priority page has incomplete intent coverage | SERP and page review | Medium | Expand missing decision criteria | Medium |
| Internal Linking | Commercial page receives weak support | Crawl data | Medium | Add relevant contextual links | Medium |
A strong SEO analysis report tells the reader where performance is being constrained, what evidence supports the diagnosis, and which action deserves attention first.
How Do You Create an SEO Report for Clients?
An SEO report for a client should translate search-performance data into business outcomes, explain important changes in clear language, document the work completed, and define what happens next.
Client reporting should not simply reproduce an internal SEO dashboard.
1. Define the Client’s Goals
Start with the outcomes the SEO engagement supports.
Examples include:
- Leads
- Sales
- Revenue
- Sign-ups
- Bookings
- Qualified traffic
- Local visibility
Use those goals to determine which metrics deserve prominence.
2. Select the Reporting Period
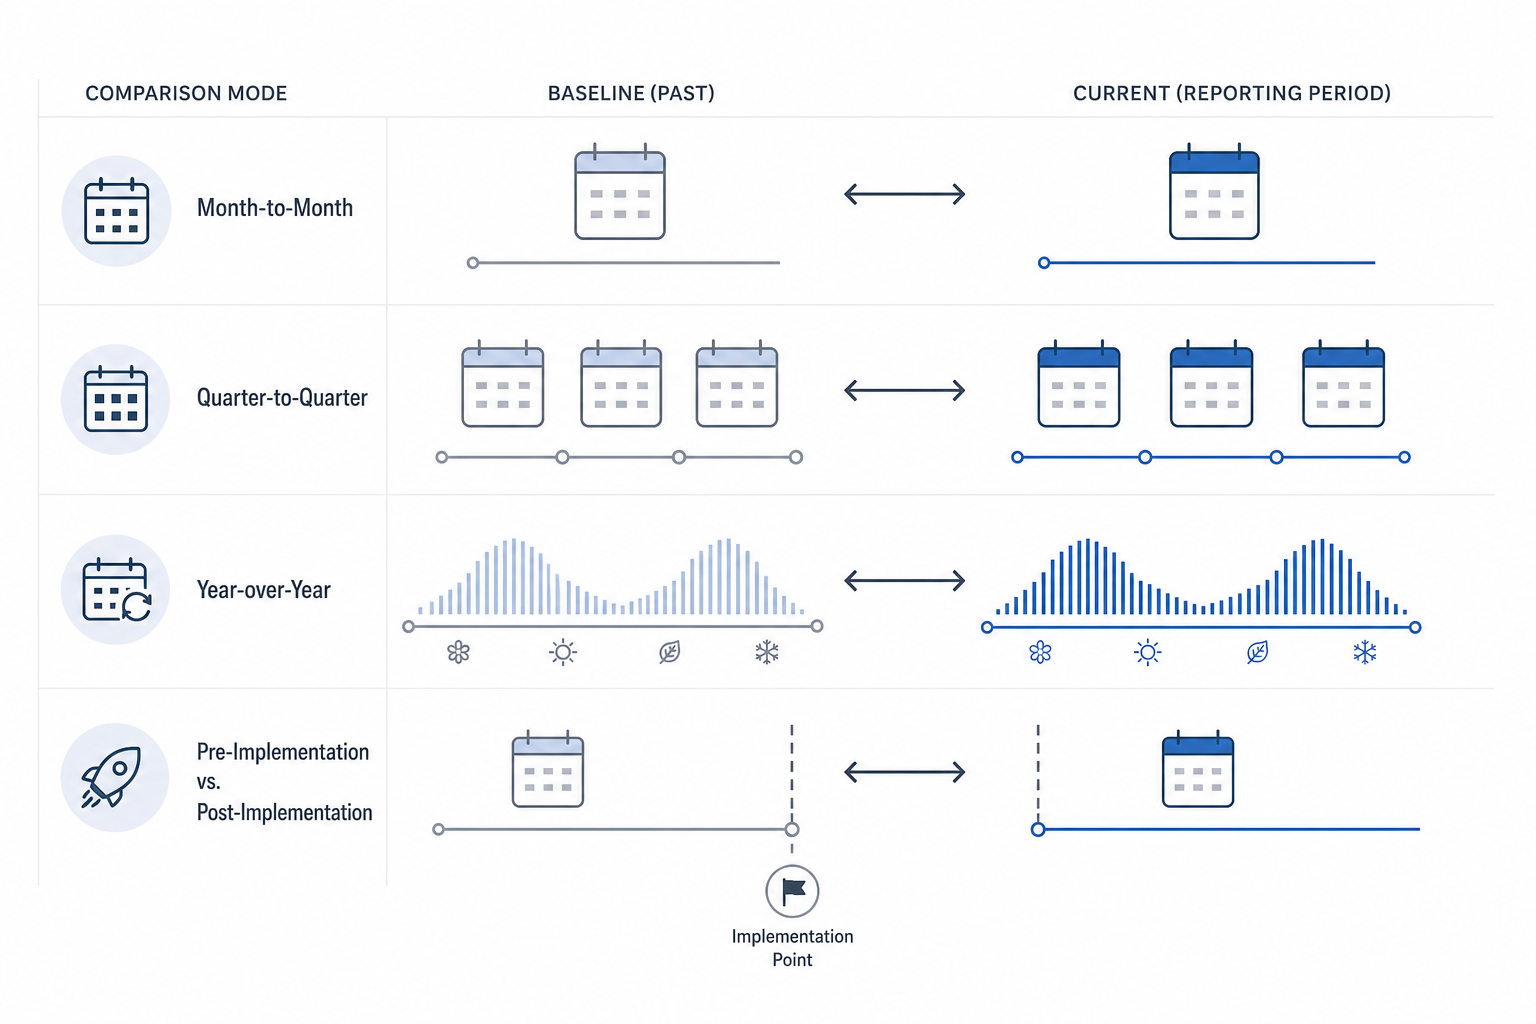
Choose a consistent timeframe and baseline.
Use month-over-month, year-over-year, or another relevant comparison.
3. Connect Reliable Data
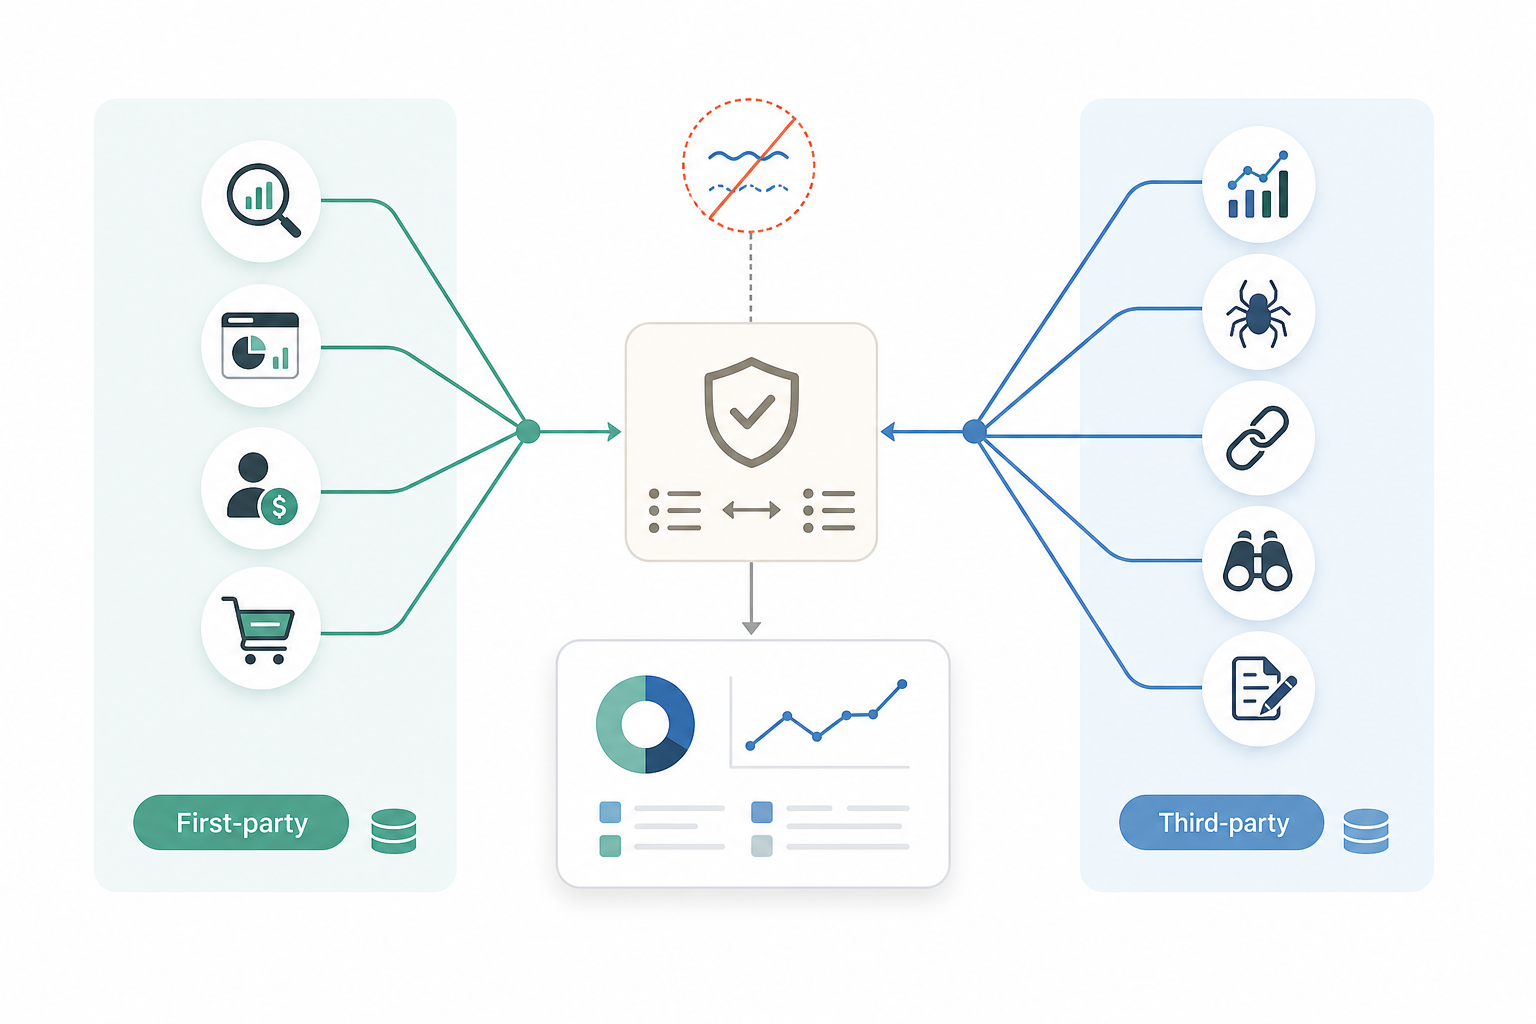
Use first-party sources where possible.
Add third-party data only where it adds useful context.
4. Lead With an Executive Summary
Place client-facing conclusions first.
Include:
- Main win
- Biggest concern
- Important business result
- Immediate priority
Use plain language.
5. Report Business KPIs
Where available, show:
- Revenue
- Leads
- Purchases
- Sign-ups
- Calls
- Bookings
Do not start with rankings when business outcomes matter more to the client.
6. Report Organic Visibility and Traffic
Show:
- Clicks
- Impressions
- CTR
- Organic sessions
- Users
- Landing-page trends
Focus on material changes.
7. Report Keyword Visibility
Include:
- Important queries
- Topic groups
- Ranking milestones
- Branded vs non-branded performance where useful
Avoid presenting hundreds of rankings that have little business relevance.
8. Report Landing-Page Performance
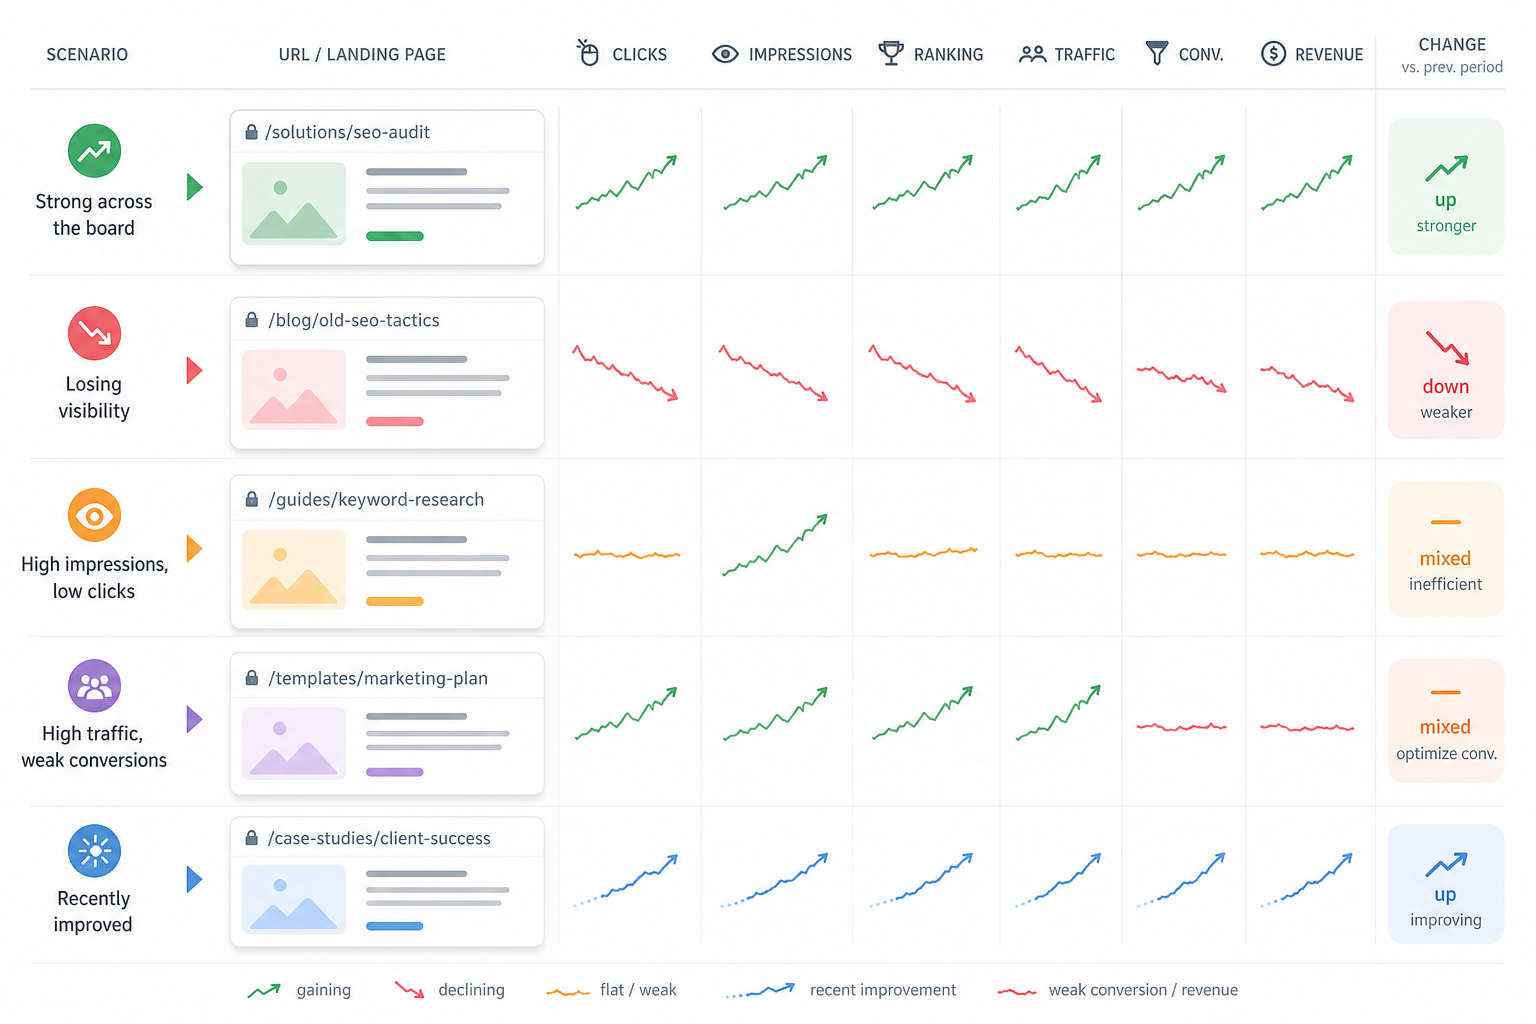
Show which URLs:
- Grew
- Declined
- Generated conversions
- Attracted visibility
- Were improved during the period
9. Summarize Technical and Backlink Changes
Include only material items.
Avoid overwhelming clients with:
- Every crawler error
- Raw backlink totals
- Tool health scores
Explain the business or search consequence.
10. Include AI Visibility Where Relevant
If AI mentions or citations are tracked, explain them separately and state the limitations of the methodology.
11. Show Work Completed
Summarize important deliverables.
Examples include:
- Pages optimized
- Content published
- Technical fixes
- Internal links
- New backlinks
- Landing pages created
Keep activity separate from results.
12. Explain Performance Changes
Add short interpretation below important metrics.
Explain likely influences in clear language.
Separate confirmed causes from hypotheses.
13. Highlight Risks and Opportunities
Identify:
- Important declines
- Indexation issues
- Growth opportunities
- Content gaps
- Technical risks
- Competitor changes
Explain what each means for the client.
14. End With Prioritized Next Steps
Give a concise action plan.
Tie each action to:
- Evidence
- Business goal
- Intended outcome
15. Review Client Readability
Remove:
- Unexplained jargon
- Crowded visuals
- Redundant metrics
- Excessive technical detail
- Tool-generated scores with no context
A strong client SEO report makes it easy to understand what happened, what value SEO contributed, what requires attention, and what the team plans to do next.
How Often Should SEO Reports Be Created?
SEO reports are commonly created monthly for ongoing campaigns, but the right frequency depends on campaign maturity, stakeholder needs, business cycles, risk level, and how quickly meaningful decisions need to be made.
Reporting too often can overemphasize short-term volatility. Reporting too infrequently can delay important decisions.
| Reporting Frequency | Best For | Main Purpose | Typical Focus | Main Limitation |
|---|---|---|---|---|
| Daily Monitoring | Migrations, incidents, launches | Detect urgent changes | Tracking, indexation, major visibility changes | Too volatile for full strategic reporting |
| Weekly / Bi-weekly | Active technical work, launches | Operational monitoring | Implementation, crawling, rankings, early signals | Limited long-term trend clarity |
| Monthly | Most ongoing SEO campaigns | Performance and planning | Traffic, clicks, rankings, conversions, work completed | Can still contain short-term variation |
| Quarterly | Strategic reviews | Evaluate broader progress | Growth trends, content, conversions, market visibility | Slower operational response |
| Annual | Budgeting and strategic planning | Long-term evaluation | YoY growth, market position, revenue contribution | Too infrequent for operational management |
Daily Monitoring
Daily dashboards can help during:
- Migrations
- Major launches
- Tracking failures
- Search incidents
- Sensitive ecommerce periods
Daily monitoring does not normally require a manually interpreted report every day.
Weekly or Bi-Weekly Reporting
Shorter reporting intervals can help during periods of rapid change.
Use them for:
- Technical remediation
- New launches
- Migration monitoring
- Large implementation programs
Avoid judging long-term SEO growth from weekly ranking volatility alone.
Monthly SEO Reports
Monthly SEO reports provide the most common cadence for established campaigns.
A monthly period usually gives enough data to review:
- Visibility
- Traffic
- Conversions
- Ranking trends
- Page performance
- Technical work
- Completed activity
- Next priorities
Monthly reporting also keeps decision-making frequent enough for ongoing optimization.
Quarterly Reporting
Quarterly reporting works well for:
- Strategic leadership reviews
- Longer sales cycles
- Broader content evaluation
- Executive reporting
- Larger strategy decisions
It helps reduce noise from individual monthly fluctuations.
Annual Reporting
Annual reviews support:
- Budget planning
- Long-term SEO strategy
- Year-over-year comparisons
- Market visibility assessment
- Revenue contribution analysis
Annual reporting should supplement rather than replace more frequent operational monitoring for active SEO campaigns.
Initial Reporting
A new SEO engagement can begin with a baseline report.
This can establish:
- Current visibility
- Organic traffic
- Rankings
- Conversions
- Technical condition
- Content condition
- Backlink profile
- Major opportunities
Later reports can then compare performance against this starting point.
Reporting frequency and data refresh frequency do not have to match.
A dashboard can refresh daily while the formal stakeholder report remains monthly.
The best cadence is frequent enough to support decisions while allowing enough time for meaningful SEO patterns to emerge.
How Do You Share and Automate SEO Reports?
SEO reports can be automated by connecting search, analytics, ranking, backlink, and other relevant data sources with a reporting system that refreshes information and distributes reports on a recurring schedule.
Automation reduces repetitive collection and delivery. It does not replace interpretation.
Connect Reliable Data Sources
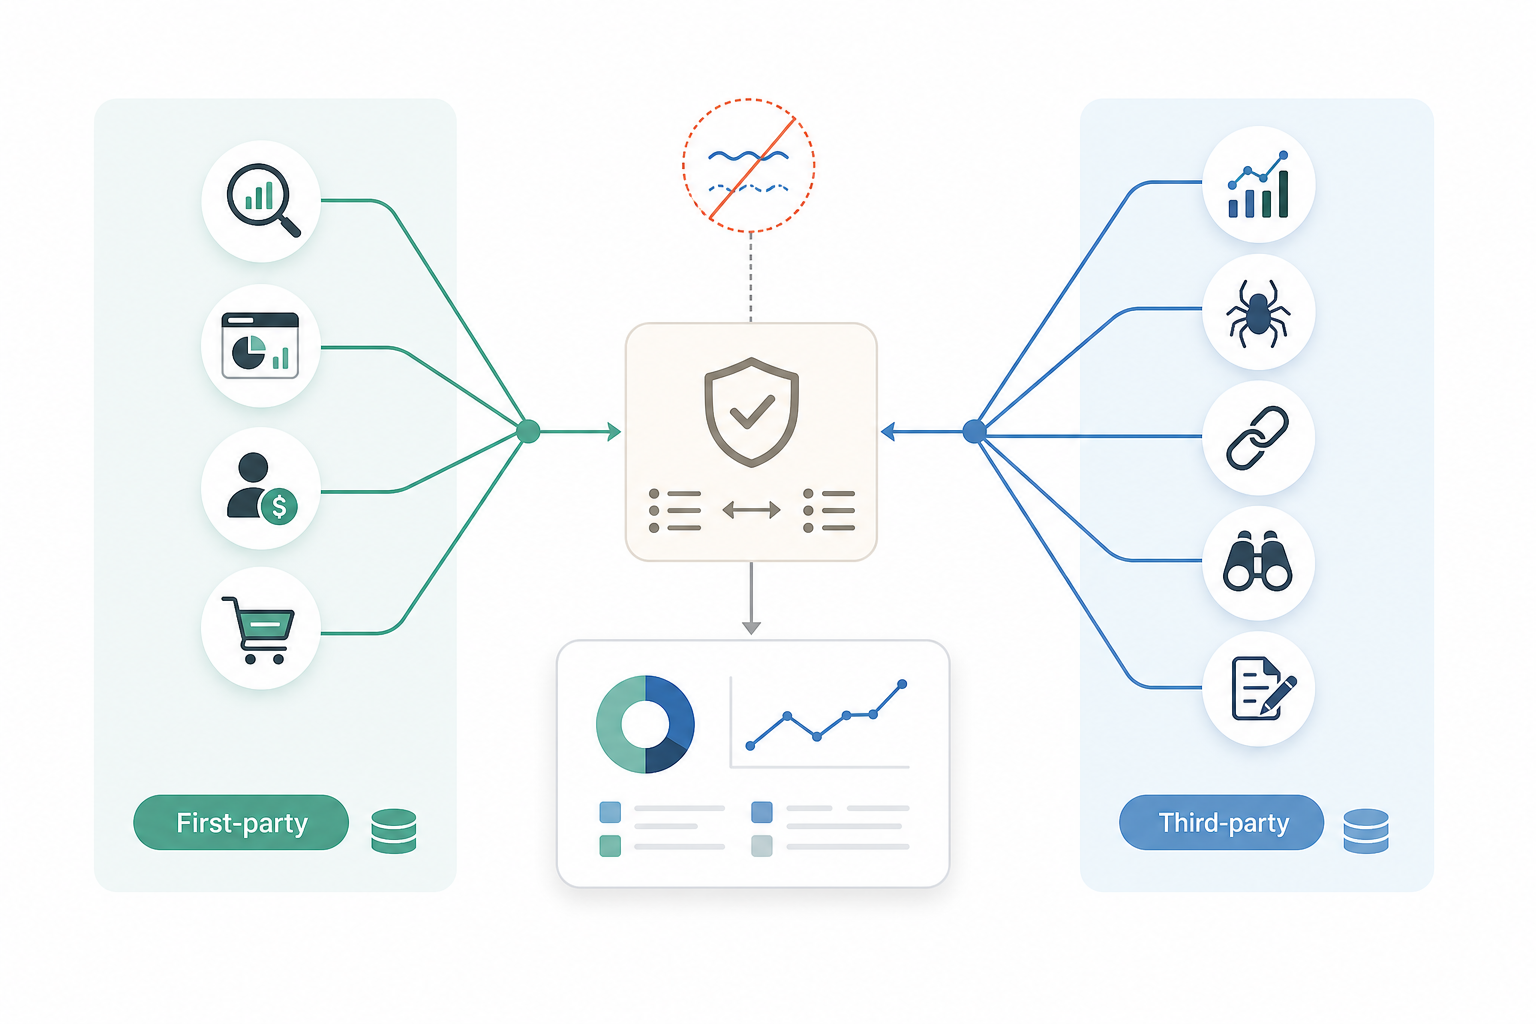
Connect the systems required by the established report.
These can include:
- Google Search Console
- Google Analytics
- Rank trackers
- Backlink tools
- Crawlers
- SEO platforms
- CRM or sales systems
Use supported integrations where available.
Choose the Reporting Platform
Possible systems include:
- Looker Studio
- SEO reporting platforms
- Business-intelligence tools
- Spreadsheet systems
- Client portals
Treat visualization systems as presentation layers rather than original SEO data sources.
Apply the Established Template
Keep the reporting structure consistent.
Automate recurring metrics such as:
- Visibility
- Traffic
- Conversions
- Rankings
- Landing-page data
- Relevant technical indicators
- Backlink metrics
Written commentary and recommendations remain period-specific.
Automate Data Refreshes
Configure the system to update data automatically where supported.
Validate:
- Date ranges
- Filters
- Comparison periods
- Conversion definitions
- Calculated fields
- Attribution settings
Automation can reproduce an incorrect calculation just as efficiently as a correct one.
Apply the Selected Reporting Cadence
Schedule delivery according to the reporting frequency already established.
Examples include:
- Weekly
- Monthly
- Quarterly
- Annual
Choose the Sharing Method
Reports can be shared through:
- Live dashboard links
- Scheduled emails
- PDFs
- Presentations
- Spreadsheets
- Client portals
Match the delivery method with the audience.
Configure Scheduled Delivery
Automated delivery reduces the manual work required each reporting period.
Clearly identify:
- Reporting period
- Comparison period
- Client or website
- Report version
Manage Access and Permissions
Review permissions carefully.
SEO reporting can contain:
- Analytics data
- Revenue information
- Client performance
- Search data
- Business information
Avoid exposing private dashboards through unintended public links.
Apply Branding Where Appropriate
Client-facing reports can include:
- Client name
- Agency name
- Logo
- Consistent report titles
Keep branding secondary to readability and accuracy.
Add Automated Alerts
Alerts can notify teams about events that require faster investigation.
Examples include:
- Sudden traffic declines
- Tracking failures
- Significant ranking changes
- Indexation problems
- Website outages
Alerts are not substitutes for recurring reports.
Validate Automated Data
Review connectors and calculations periodically.
Check:
- Metric definitions
- Filters
- Data-source changes
- Conversion events
- Attribution
- Tracking continuity
Do not assume that an automated system remains accurate indefinitely.
Add Human Interpretation
Review important automated reports before stakeholder delivery.
Add commentary explaining:
- Major gains
- Declines
- Likely causes
- Risks
- Opportunities
- Recommended next actions
Automatically generated commentary and health scores require validation before they become strategic conclusions.
Archive Historical Reports
Maintain fixed snapshots where historical accountability matters.
Monthly, quarterly, and annual report archives allow teams to compare:
- Previous conclusions
- Performance trends
- Actions completed
- Prior forecasts
- Changes in priorities
An effective SEO reporting system reduces repetitive reporting work while preserving accurate data, meaningful interpretation, clear recommendations, and stakeholder understanding.
Need links on real SaaS and business websites?
Links are placed after your approval, on sites with guaranteed DR and traffic, with a 1-year replacement guarantee.

