
SEO Analytics: Data, Metrics, Tools, Performance, Insights & Reporting
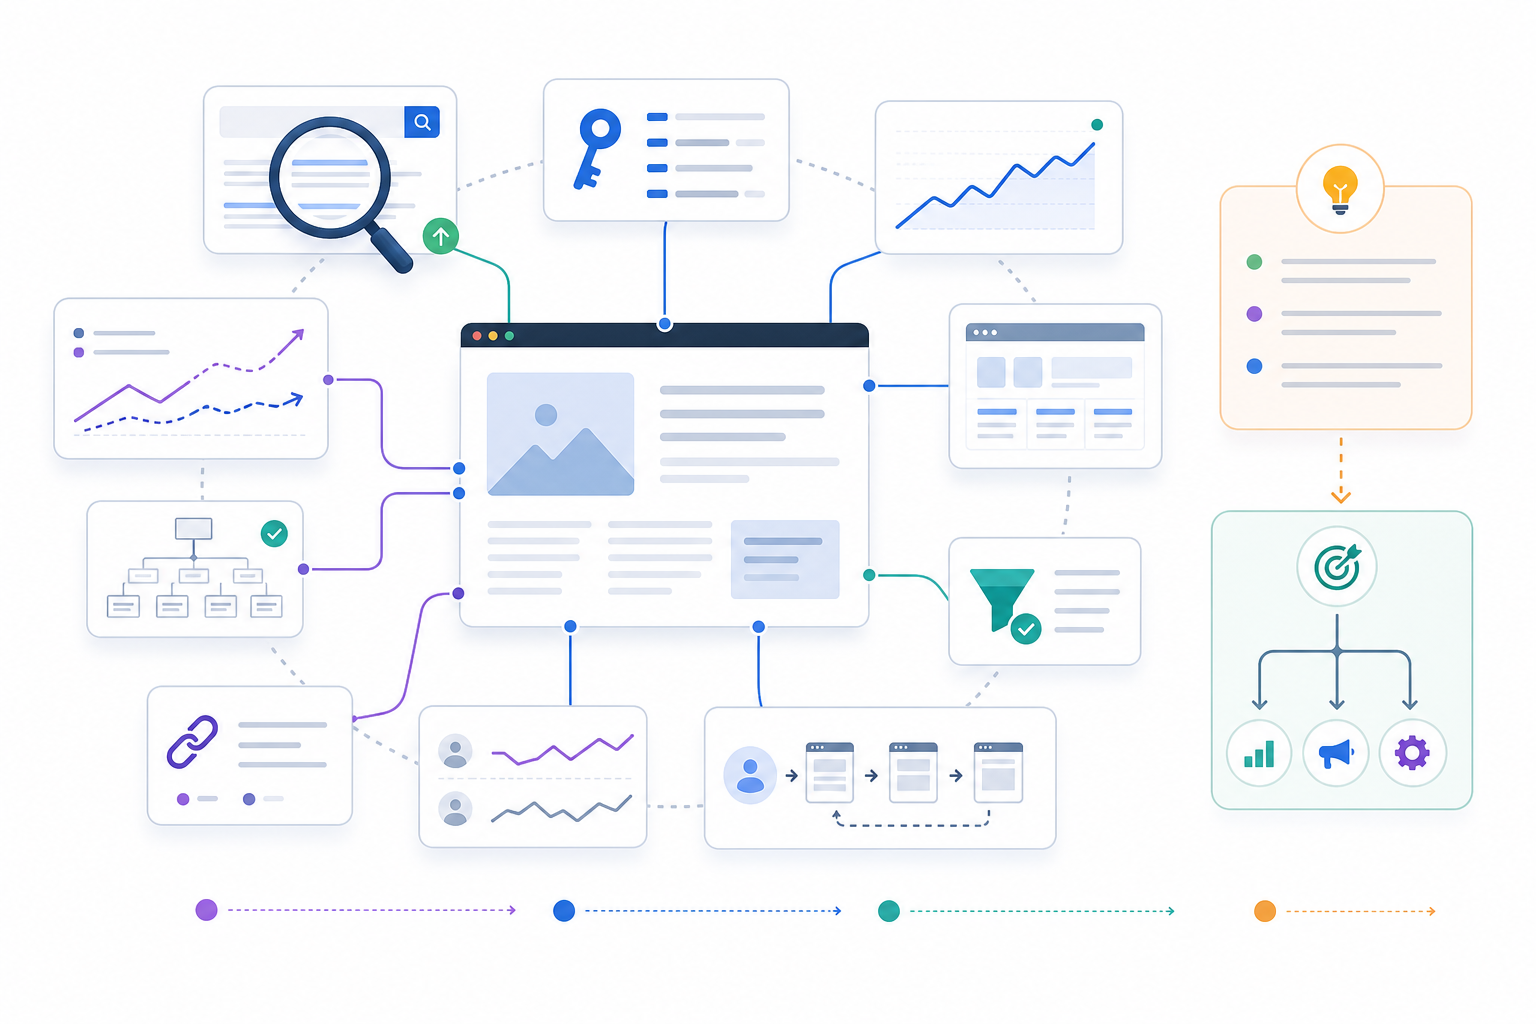
SEO analytics is the process of collecting, measuring, organizing, and interpreting organic-search data to understand website performance and support SEO decisions. It combines evidence about search visibility, organic traffic, landing pages, user behavior, technical health, backlinks, conversions, and business outcomes.
SEO analytics goes beyond checking rankings or opening Google Analytics. It creates a broader measurement system that explains how a website appears in search, which pages attract organic visitors, what those visitors do after arriving, and whether search visibility contributes to meaningful business results.
For example, a website can record a 20% increase in impressions without receiving a similar increase in clicks. Organic traffic can grow while conversions remain unchanged. Rankings can improve while revenue declines because the traffic comes from lower-value informational searches. Looking at one metric alone does not explain overall SEO performance.
SEO analytics brings these different signals together so performance can be evaluated in context.
The evidence can include:
- Search visibility and query data
- Keyword rankings
- Organic traffic
- Landing-page performance
- User behavior
- Conversion activity
- Revenue or pipeline data
- Technical SEO information
- Backlink and referring-domain data
- Content performance
- Competitor data
Different data sources answer different questions. Search-engine platforms show how pages perform in search. Analytics platforms show what users do after reaching the site. Crawlers provide technical website evidence. Third-party SEO tools provide modeled keyword, backlink, competitor, and visibility data. CRM and revenue systems can connect organic acquisition with business results.
SEO analytics is also distinct from SEO analysis. Analytics establishes and monitors the evidence, while analysis investigates that evidence to understand why performance changed and what may require action.
The value of SEO analytics therefore comes from combining reliable measurement with interpretation rather than treating individual rankings, traffic numbers, engagement metrics, authority scores, or technical-health scores as complete measures of success.
How Is SEO Analytics Different From SEO Analysis?
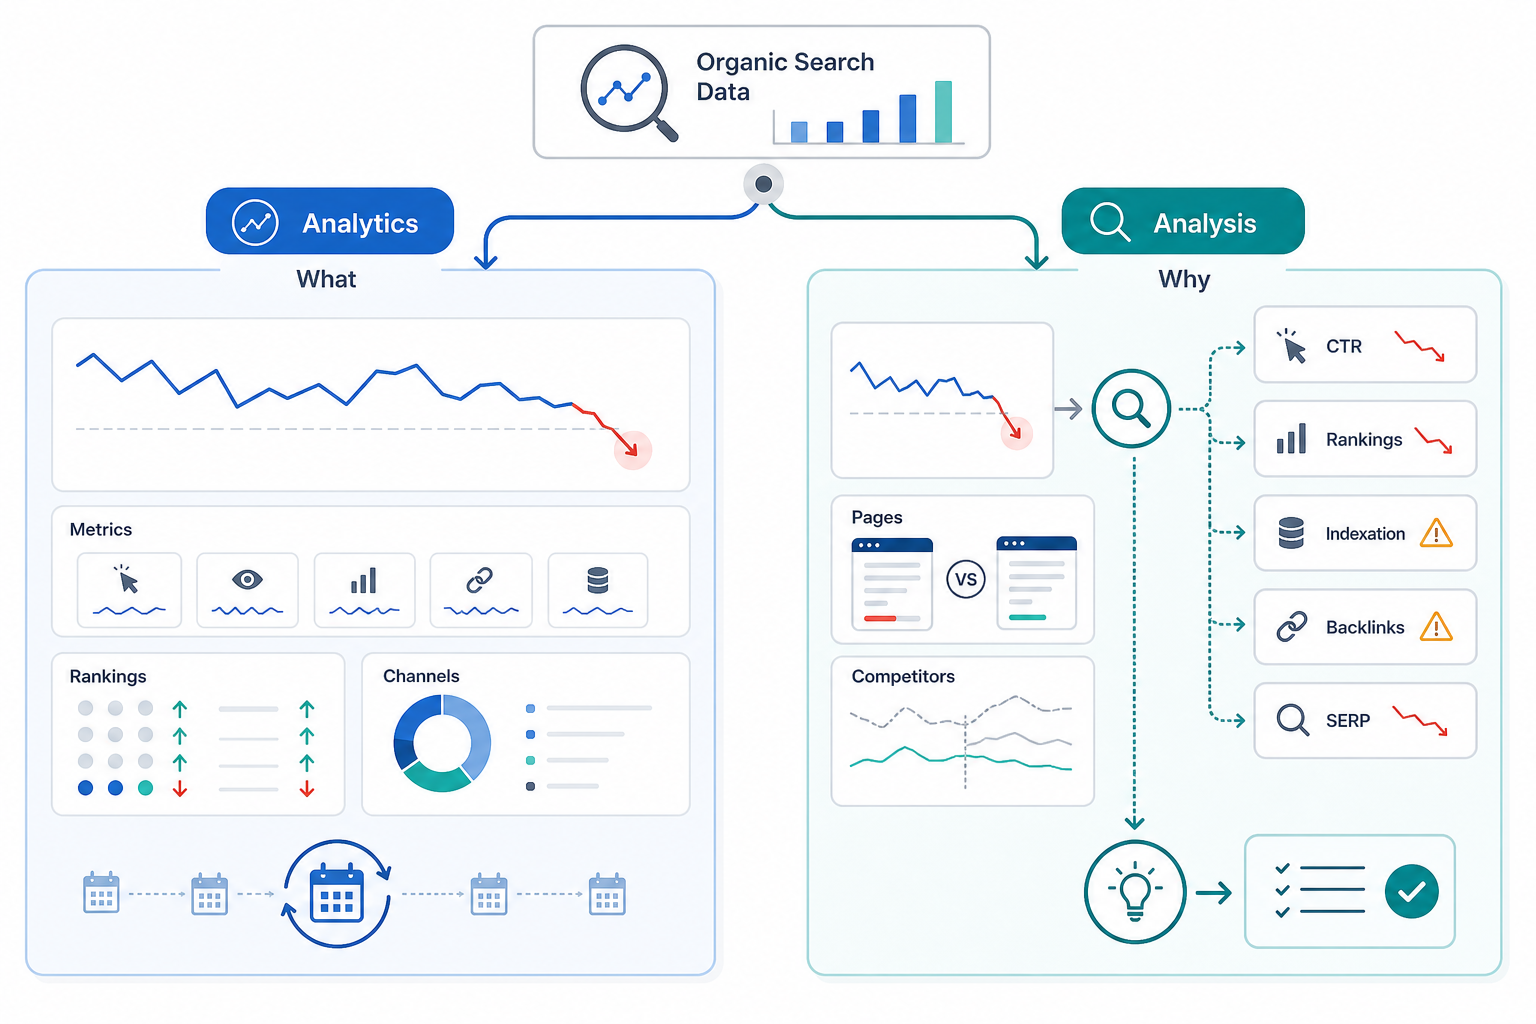
SEO analytics is the broader process of collecting, organizing, measuring, and monitoring organic-search data, while SEO analysis interprets that evidence to understand causes, diagnose problems, identify opportunities, and guide decisions.
Both use many of the same data sources, but they perform different functions.
| Dimension | SEO Analytics | SEO Analysis |
|---|---|---|
| Primary Purpose | Measure and monitor performance | Interpret performance and diagnose causes |
| Main Question | What is happening? | Why is it happening, and what needs attention? |
| Scope | KPIs, trends, dashboards, recurring measurement | Specific issues, opportunities, anomalies, and strategic questions |
| Typical Inputs | Clicks, impressions, rankings, traffic, conversions, backlinks, technical data | The same data plus contextual investigation |
| Typical Activities | Track metrics, compare periods, segment data, monitor trends | Investigate causes, compare pages, evaluate competitors, diagnose problems |
| Typical Outputs | Dashboards, KPI summaries, trends, recurring reports | Findings, diagnoses, opportunities, recommendations |
| Time Orientation | Continuous or recurring | Triggered by a question, decline, opportunity, audit, or review |
| Decision Role | Establishes the evidence base | Converts evidence into an explanation or decision |
Consider a website where organic clicks decline by 20%.
SEO analytics establishes that:
- Clicks fell 20%
- Impressions fell 8%
- Several priority pages lost search visibility
- Organic conversions also declined
SEO analysis goes further by investigating whether the movement relates to:
- Ranking losses
- Lower search demand
- Reduced CTR
- Indexation problems
- Content changes
- Competitor improvements
- Lost backlinks
- SERP changes
- Another technical or market factor
Analytics can therefore show that performance moved. Analysis investigates what that movement means.
SEO reporting is related but also distinct. Reporting communicates selected analytics and analysis to clients, managers, SEO teams, or other stakeholders.
Reliable SEO decision-making requires both measurement and interpretation.
What Data Does SEO Analytics Use?
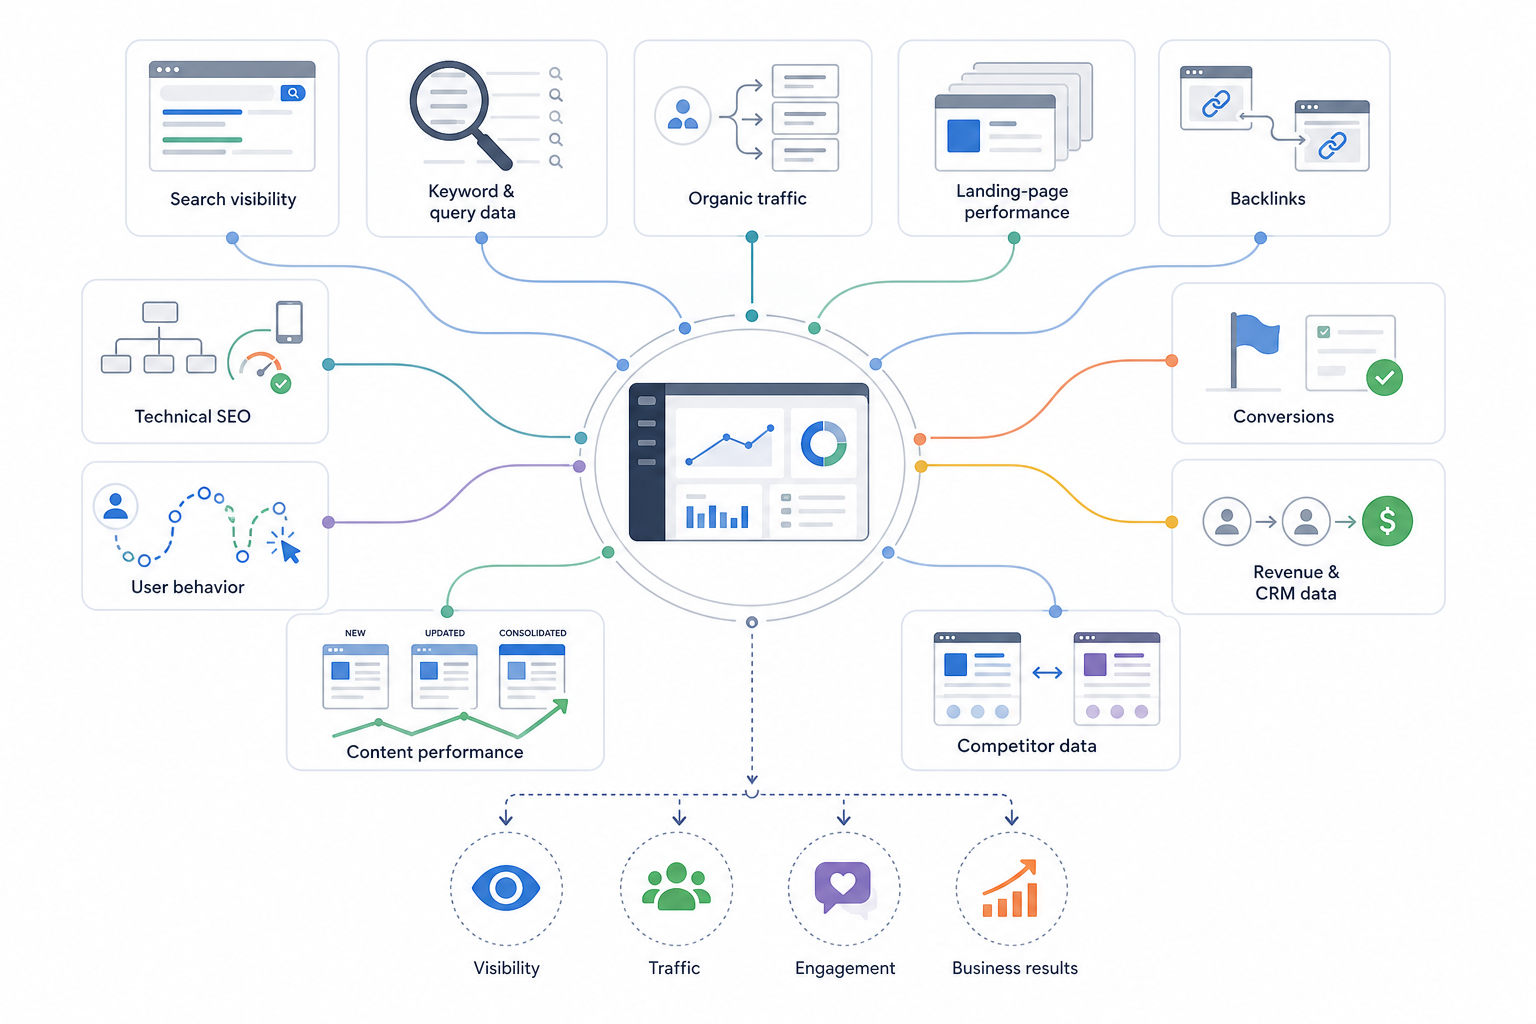
SEO analytics uses search-performance, website, technical, user-behavior, competitive, and business data to measure how organic search contributes to visibility, traffic, engagement, and outcomes.
No single dataset explains the entire organic-search journey.
Search Visibility Data
Search visibility data measures how often and how prominently a website appears in search results.
Common data includes:
- Impressions
- Clicks
- CTR
- Search queries
- Average position
- Page-level visibility
This information helps determine whether search exposure is growing or declining.
For example, increasing impressions with flat clicks can indicate that the website is appearing for more queries without generating equivalent traffic.
Keyword and Query Data
Keyword and query data helps measure the searches associated with website visibility.
It can include:
- Ranking positions
- Search queries
- Keyword groups
- Search demand
- Ranking changes
- Branded and non-branded visibility
- Topic-level visibility
Actual Search Console queries differ from third-party keyword databases. Search Console reports Google Search data for the verified property, while SEO platforms estimate broader keyword markets using their own datasets.
Organic Traffic Data
Organic traffic data measures visits arriving through unpaid search.
Useful data includes:
- Organic sessions
- Organic users
- New users
- Landing-page visits
- Traffic trends
Segment traffic where useful by:
- Landing page
- Directory
- Content type
- Device
- Country
- Market
- Topic
Sitewide traffic can hide substantial differences between sections.
Landing-Page Performance Data
Landing-page data connects overall organic performance with specific URLs.
Review:
- Search clicks
- Impressions
- Rankings
- Organic sessions
- Conversions
- Revenue where available
This helps identify which pages produce growth and which pages contribute to declines.
Backlink Data
Backlink data provides evidence about external authority.
Useful information includes:
- Referring domains
- New links
- Lost links
- Important backlinks
- Linked pages
- Anchor patterns
- Competitor link gaps
Raw backlink totals have limited value without relevance and quality context.
Technical SEO Data
Technical data measures conditions that affect search accessibility and website performance.
Examples include:
- Crawlability
- Indexation
- Status codes
- Redirects
- Canonicals
- XML sitemap states
- Core Web Vitals
- Structured data
- Mobile accessibility
- Rendering
Technical data helps determine whether infrastructure problems correspond with search-performance issues.
User-Behavior Data
User-behavior data explains what visitors do after reaching the website.
Useful data can include:
- Engagement
- Navigation
- Landing-page interaction
- Event completion
- Conversion paths
Metrics such as engagement rate or time on page require context.
They describe user behavior but should not be treated as direct Google ranking signals.
Conversion Data
Conversion data connects organic acquisition with meaningful actions.
Depending on the website, conversions can include:
- Purchases
- Leads
- Form submissions
- Demo requests
- Sign-ups
- Calls
- Bookings
- Downloads
A traffic increase becomes more meaningful when the resulting visitors also complete the website’s intended actions.
Revenue and CRM Data
Business systems can extend SEO analytics beyond website activity.
Relevant data can include:
- Qualified leads
- Opportunities
- Pipeline
- Closed sales
- Revenue
- Customer value
This data often exists outside conventional SEO platforms.
When attribution is available, it helps determine which organic landing pages, topics, or acquisition patterns contribute to commercial outcomes.
Content Performance Data
Content analytics measures how published or updated pages perform.
Track:
- New pages
- Updated pages
- Consolidated pages
- Visibility changes
- Traffic changes
- Conversion changes
Performance evidence can help identify which content areas are improving and which require deeper investigation.
Competitor Data
Third-party platforms can provide comparative data about competing websites.
This can include:
- Estimated organic visibility
- Keyword rankings
- Traffic estimates
- Backlinks
- Content gaps
- Ranking pages
Competitor data is modeled evidence rather than first-party website data.
SEO analytics works best when these different sources are interpreted together rather than relying on one isolated dataset.
What Metrics Does SEO Analytics Track?
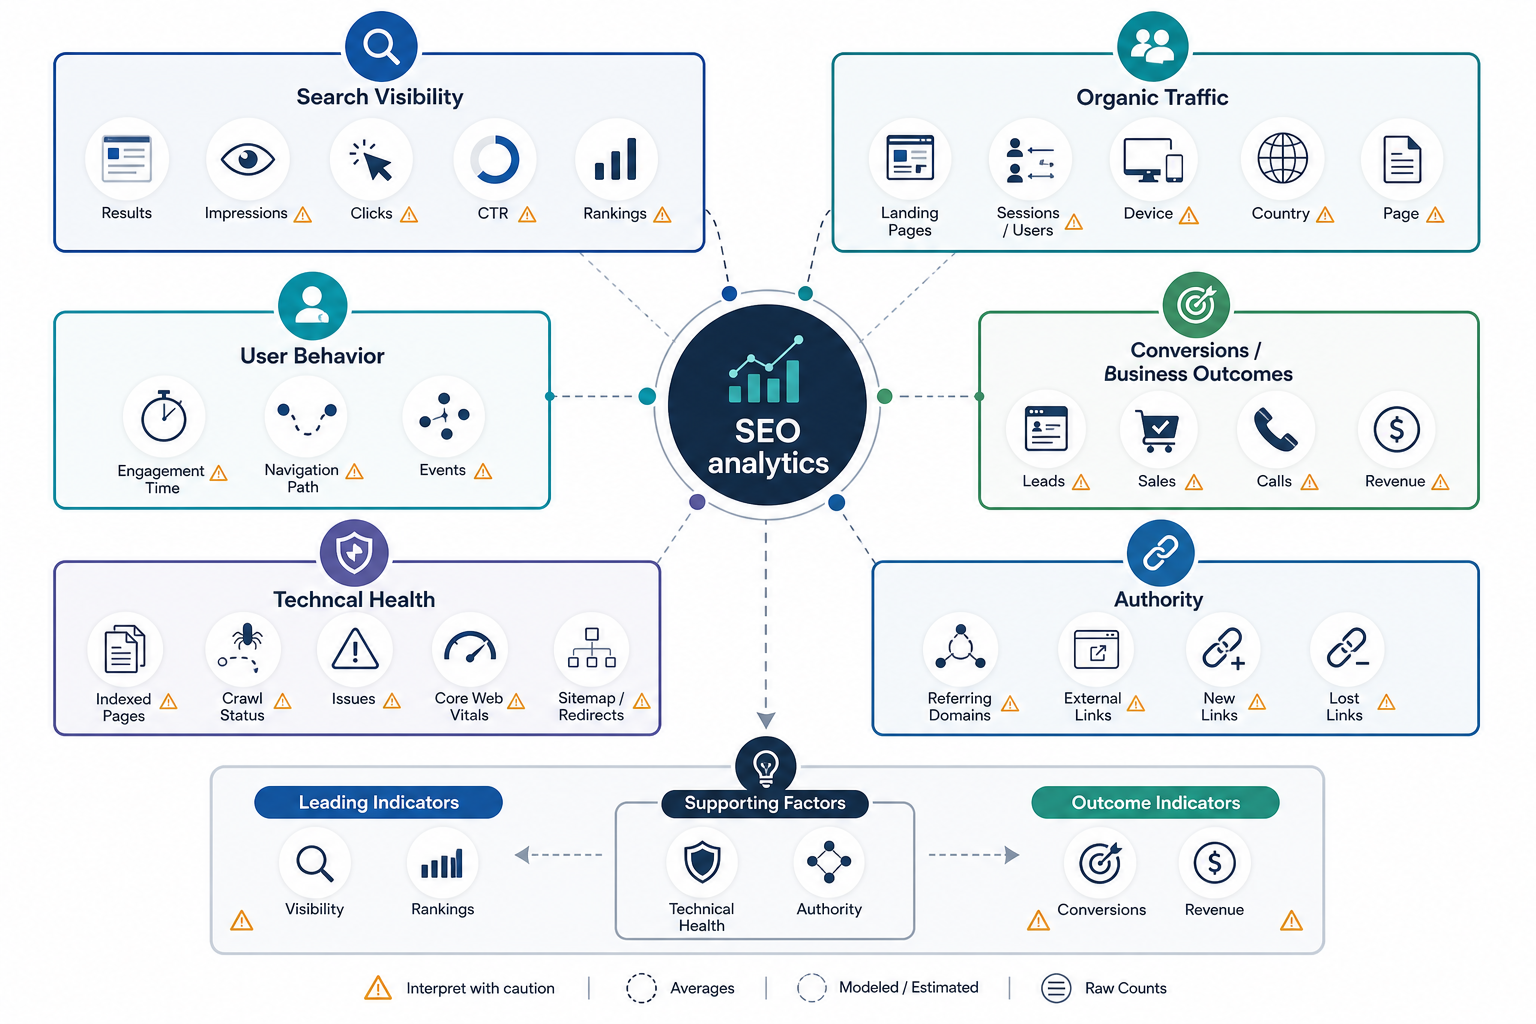
SEO analytics tracks measurable indicators across search visibility, organic traffic, user behavior, conversions, technical performance, and authority.
No individual metric represents SEO success by itself.
| Metric | Performance Type | What It Measures | Why It Matters | Main Interpretation Caution |
|---|---|---|---|---|
| Impressions | Search Visibility | Search-result appearances | Shows exposure to search demand | More impressions do not automatically produce traffic |
| Clicks | Search Visibility | Organic search visits | Measures acquired search traffic | Requires query and page context |
| CTR | Search Visibility | Clicks relative to impressions | Shows search-result engagement | Influenced by position, intent, and SERP composition |
| Average Position / Rankings | Search Visibility | Search positions | Shows competitive visibility | Averages can hide major query differences |
| Visibility Score | Search Visibility | Estimated presence across tracked keywords | Useful for comparison | Usually a third-party modeled metric |
| Organic Sessions / Users | Traffic | Visits from organic search | Measures acquired website traffic | Sitewide growth can hide page-level declines |
| Landing-Page Traffic | Traffic | Organic visits by URL | Shows which pages drive traffic | Requires intent and business context |
| Engagement Rate / Time | User Behavior | Post-click interaction | Adds behavioral context | Not a direct ranking measure |
| Organic Conversions | Business Outcome | Desired actions from organic visitors | Connects SEO with outcomes | Depends on tracking quality |
| Organic Conversion Rate | Business Outcome | Conversion efficiency | Shows traffic quality and page effectiveness | Influenced by landing-page mix |
| Revenue / Pipeline | Business Outcome | Commercial contribution | Connects SEO with business value | Attribution can be incomplete |
| Indexed Pages | Technical Health | URLs present or eligible in search indexes | Helps monitor indexation | More indexed pages are not automatically better |
| Core Web Vitals | Technical Health | Loading, responsiveness, stability | Measures page-experience performance | Not a standalone SEO-success metric |
| Crawl / Status Issues | Technical Health | Technical accessibility problems | Identifies website constraints | Raw error totals can exaggerate importance |
| Referring Domains | Authority | Unique linking websites | Indicates external link support | Quality and relevance matter more than count |
| New / Lost Links | Authority | Changes in backlink support | Helps monitor authority changes | Not every gained or lost link is significant |
Search Visibility Metrics
Search visibility metrics show whether pages are appearing for relevant searches.
Impressions
Impressions show how often a result appears in search.
Rising impressions can indicate:
- Broader query coverage
- Improved rankings
- Increasing search demand
- New page visibility
They do not indicate that users actually clicked.
Clicks
Clicks show how many search-result appearances produced visits.
Analyze clicks alongside:
- Impressions
- CTR
- Queries
- Landing pages
- Positions
CTR
CTR measures the share of impressions producing clicks.
Low CTR can relate to:
- Ranking position
- Search intent
- SERP features
- Competing results
- Result presentation
It should not automatically be interpreted as a metadata problem.
Rankings and Average Position
Rankings help monitor competitive search visibility.
Track strategically important queries and groups.
Avoid relying on one average-position value because results can vary across:
- Queries
- Locations
- Devices
- Time periods
- SERP environments
Organic Traffic Metrics
Organic sessions and users show how much website traffic arrives from organic search.
Break traffic down by:
- Page
- Directory
- Topic
- Content type
- Device
- Country
This reveals where growth or decline actually originates.
User-Behavior Metrics
Engagement metrics add context about what users do after arriving.
Useful indicators can include:
- Engagement rate
- Engagement time
- Relevant events
- Navigation behavior
- Pages per session where appropriate
Bounce rate can also be used where its platform definition is clearly understood.
These metrics describe behavior rather than functioning as direct ranking signals.
Conversion and Business Metrics
Business outcomes provide stronger evidence of SEO value than visibility alone.
Track relevant outcomes such as:
- Leads
- Sales
- Sign-ups
- Calls
- Revenue
- Pipeline
- Qualified enquiries
Traffic becomes commercially meaningful when it contributes to the website’s intended goals.
Technical Metrics
Technical SEO analytics can include:
- Indexation states
- Crawl problems
- Status codes
- Core Web Vitals
- Redirects
- Canonical issues
- Sitemap problems
Technical metrics provide supporting evidence about website health rather than replacing organic-performance measurement.
Authority Metrics
Referring domains, new links, lost links, and important backlinks can help explain changes in external authority.
Third-party authority scores can also provide comparative context.
These scores are proprietary measurements, not Google ranking metrics.
Effective SEO search analytics combines leading indicators such as visibility and rankings with outcome indicators such as traffic, conversions, pipeline, and revenue.
What SEO Analytics Tools and Software Can You Use?
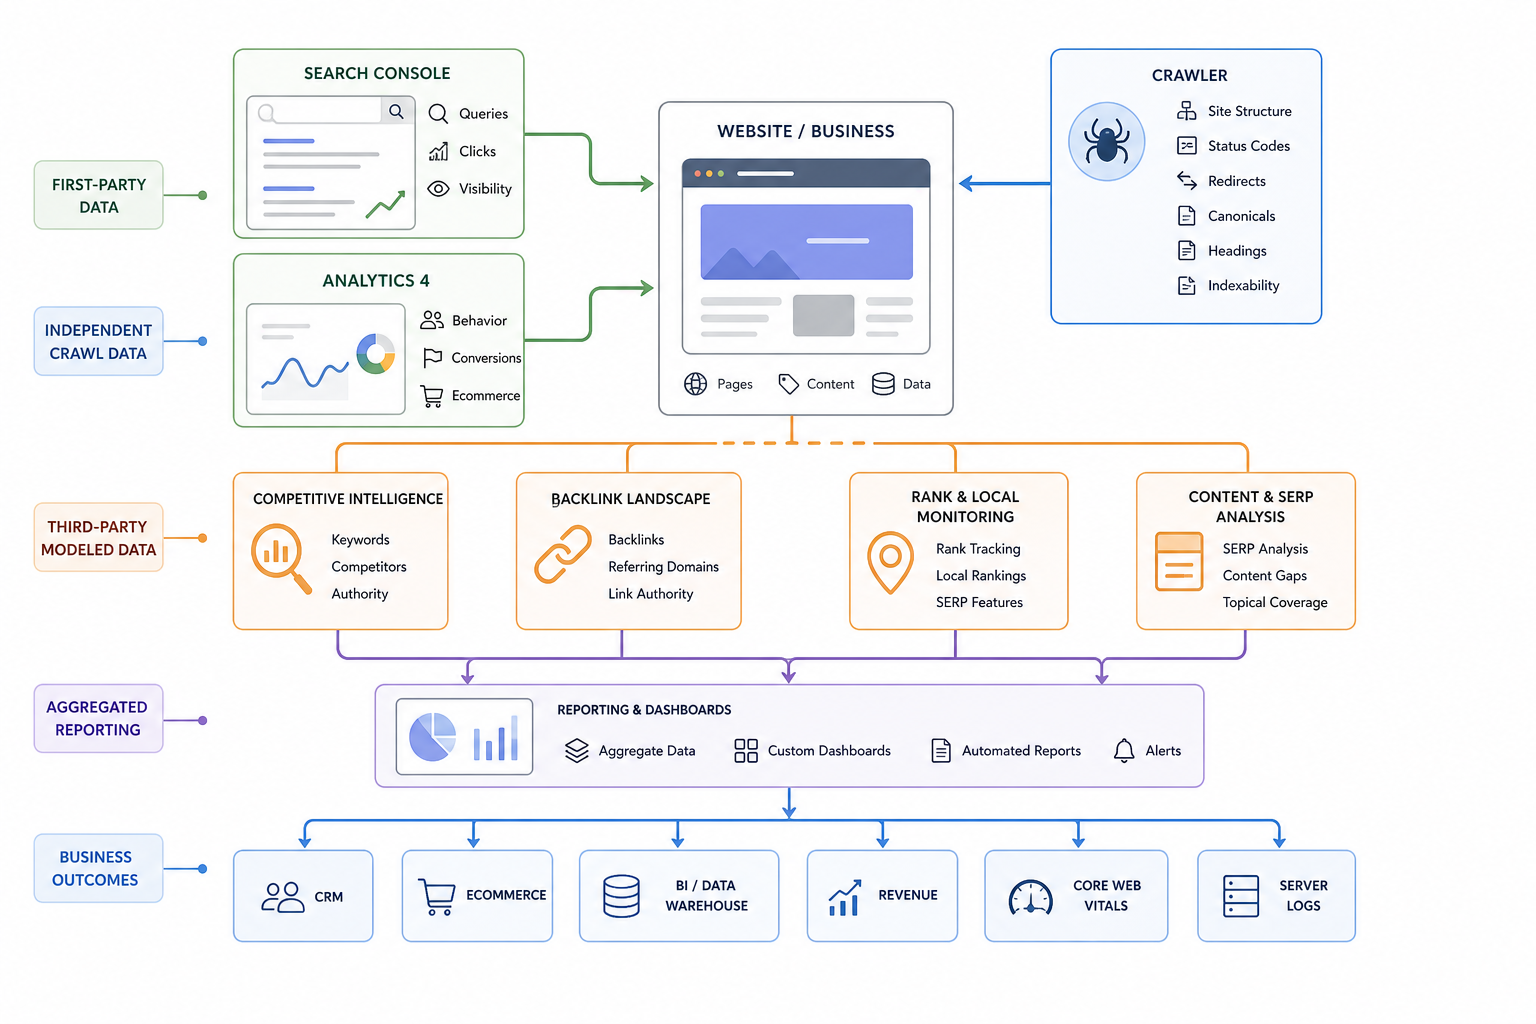
SEO analytics tools help collect, measure, compare, and visualize data about search visibility, traffic, technical health, backlinks, competitors, and business outcomes.
No single platform provides every type of SEO evidence. That is why a broader stack of SEO tools is usually needed to combine search data, analytics, crawling, backlink intelligence, competitor research, and reporting.
| Tool | Best For | Main Data / Capability | Data Type | When to Use It |
|---|---|---|---|---|
| Google Search Console | Search visibility | Clicks, impressions, CTR, queries, position, indexing | First-party Google Search data | Measure actual Google Search performance |
| Google Analytics 4 | Traffic and conversions | Organic users, sessions, landing pages, engagement, conversions | First-party website analytics | Measure post-click website behavior |
| Screaming Frog SEO Spider | Technical crawling | Status codes, redirects, canonicals, headings, links, indexability | Independent crawl data | Analyze technical website conditions |
| Semrush | SEO and competitor research | Rankings, keywords, competitors, backlinks, audits | Third-party modeled data | Competitive and broader SEO analytics |
| Ahrefs | Backlinks and search competition | Backlinks, referring domains, keywords, ranking pages | Third-party modeled data | Authority and competitor analysis |
| SE Ranking | Recurring monitoring | Rankings, competitors, audits, local visibility | Third-party data | Ongoing SEO monitoring |
| AgencyAnalytics | Reporting | Multi-source dashboards and reporting | Aggregated connected data | Client and recurring reporting |
| Surfer SEO | Content analysis | Topical and SERP-based content data | Third-party content analysis | Supporting content evaluation |
Google Search Console
Google Search Console provides direct evidence about how a verified website performs in Google Search.
Use it for:
- Queries
- Impressions
- Clicks
- CTR
- Average position
- Search appearances
- Pages
- Indexing-related information
It is one of the most important data sources for understanding actual Google Search visibility.
Google Analytics 4
Google Analytics 4 measures what users do after reaching the website.
Use it for:
- Organic sessions
- Organic users
- Landing pages
- Engagement
- Events
- Conversions
- Revenue where configured
Search Console and GA4 answer different questions.
Search Console explains search exposure and clicks. GA4 explains the website activity that occurs after the visit begins.
Screaming Frog SEO Spider
Screaming Frog provides technical crawl data.
Use it to collect information about:
- Status codes
- Redirects
- Canonicals
- Titles
- Headings
- Internal links
- Indexability
- Directives
- Website structure
It is a crawler rather than a traffic analytics system.
Semrush
Semrush provides third-party SEO data across areas such as:
- Keyword rankings
- Competitors
- Backlinks
- Visibility
- Site auditing
- Keyword research
Its competitor traffic and visibility figures are modeled rather than first-party website analytics.
Ahrefs
Ahrefs provides evidence about:
- Backlinks
- Referring domains
- Keyword visibility
- Competitor pages
- Ranking pages
- Site audits
- Content opportunities
It adds useful competitive and authority context but does not replace Search Console or analytics data.
SE Ranking
SE Ranking can support:
- Rank tracking
- Competitor monitoring
- Website auditing
- Local search tracking
- Recurring performance monitoring
AgencyAnalytics
AgencyAnalytics primarily acts as a reporting and dashboard layer.
It can combine data from multiple marketing and SEO platforms into recurring reports.
The displayed data still originates from connected sources.
Surfer SEO
Surfer supports content analysis through data derived from competing search results and terminology patterns.
It can help evaluate topical coverage, but its content scores should not be treated as direct Google ranking metrics.
Additional Data Systems
Specialized analytics can also use:
- Server-log analyzers
- Core Web Vitals tools
- CRM platforms
- Ecommerce platforms
- Business-intelligence systems
- Looker Studio
- Revenue databases
A practical SEO analytics stack usually combines first-party search data, website analytics, technical crawl evidence, third-party competitor or backlink data, and business-outcome data where available.
How Do You Analyze Website SEO Performance?
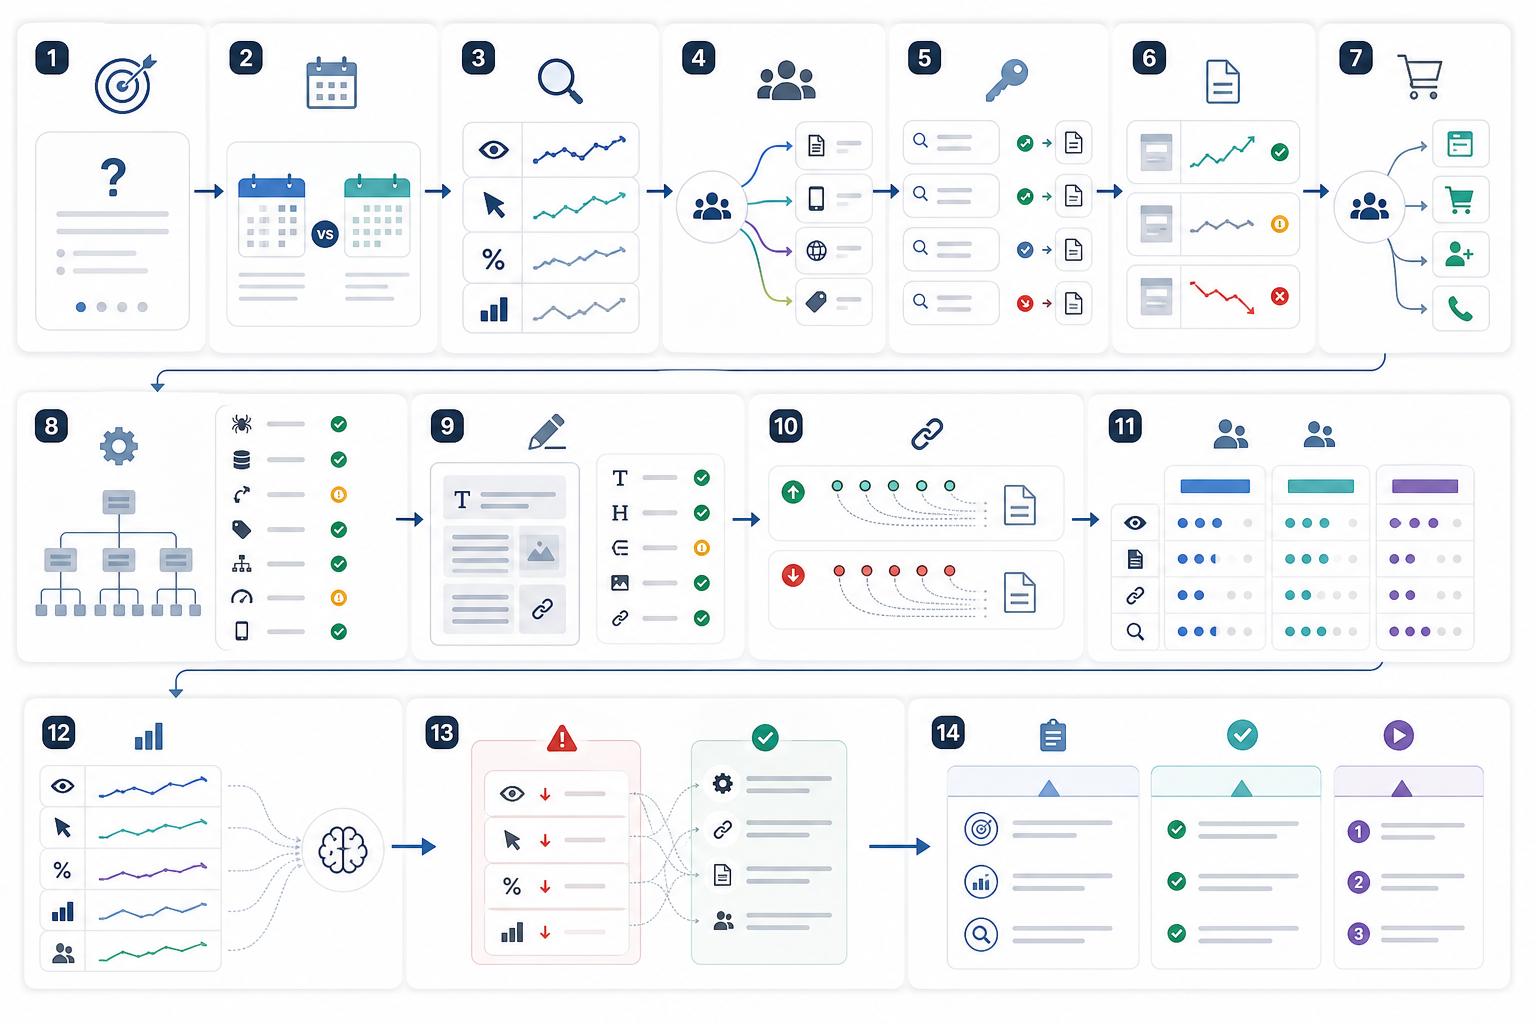
Website SEO performance is analyzed by comparing search visibility, traffic, rankings, landing-page results, conversions, technical health, and authority signals over time to determine what is improving, declining, or limiting growth.
1. Define the Performance Objective
Establish the question the analysis needs to answer.
Examples include:
- Is organic visibility growing?
- Why did traffic decline?
- Which pages generate conversions?
- Which website section is underperforming?
- Did a recent implementation improve performance?
- Where is organic growth being constrained?
The objective determines which data deserves attention.
2. Select the Comparison Period
Choose a meaningful baseline.
Possible comparisons include:
- Month over month
- Quarter over quarter
- Year over year
- Pre-implementation vs post-implementation
- Current vs historical baseline
Consider seasonality where relevant.
3. Analyze Search Visibility
Review:
- Impressions
- Clicks
- CTR
- Position trends
- Query groups
- Topic visibility
Determine whether the website appears more or less frequently across relevant searches.
Avoid relying on average position alone.
4. Analyze Organic Traffic
Review:
- Organic sessions
- Organic users
- Landing pages
- Traffic trends
Segment the data by:
- Page
- Directory
- Topic
- Device
- Country
- Content type
This identifies where sitewide changes originate.
5. Analyze Keyword and Query Performance
Identify:
- Queries gaining visibility
- Queries losing visibility
- Pages associated with those queries
- Strategic keyword groups
- Branded and non-branded performance
Focus on meaningful search demand rather than isolated ranking fluctuations.
6. Analyze Landing-Page Performance
Find the pages responsible for the largest changes.
Review:
- Clicks
- Impressions
- Traffic
- Rankings
- Conversions
Compare these changes with relevant page updates, technical changes, content revisions, or internal-link improvements where appropriate.
7. Analyze Conversions and Business Outcomes
Review:
- Leads
- Purchases
- Sign-ups
- Calls
- Revenue
- Pipeline
- Other organic outcomes
Determine whether increased visibility and traffic correspond with business performance.
Traffic growth without conversion growth deserves a different interpretation from traffic and conversions increasing together.
8. Evaluate Technical SEO Health
Investigate technical evidence when it may explain the performance movement.
Review relevant issues involving:
- Crawlability
- Indexation
- Redirects
- Canonicals
- XML sitemaps
- Core Web Vitals
- Mobile accessibility
- Rendering
Focus on problems affecting important URLs.
9. Evaluate On-Page and Content Performance
Where deeper investigation is required, review:
- Search intent
- Titles
- Headings
- Content quality
- Topic coverage
- Internal links
- Page relevance
Avoid relying on rigid title-length, keyword-density, or exact-match rules.
10. Evaluate Backlink and Authority Changes
Review meaningful:
- New referring domains
- Lost referring domains
- Important backlinks
- Link changes affecting priority pages
Relevance and quality matter more than raw link totals.
11. Compare Competitor Performance
Where useful, review competing pages or domains for:
- Keyword visibility
- Content coverage
- Backlinks
- SERP features
- Search presence
Competitor evidence helps explain relative performance and identify gaps.
12. Identify Performance Patterns
Interpret connected metrics together.
Examples include:
- Impressions down and rankings down: search visibility has weakened.
- Impressions stable and CTR down: search exposure remains similar, but fewer impressions produce clicks.
- Traffic stable and conversions down: acquisition remains stable while business performance weakens.
- Traffic up and conversions flat: new traffic may differ in intent or landing-page quality.
- Rankings stable and impressions down: search demand can be declining even without ranking losses.
These are diagnostic patterns rather than universal conclusions.
13. Separate Symptoms From Likely Causes
A performance decline is an outcome, not necessarily the root cause.
Possible causes can include:
- Indexation problems
- Ranking losses
- Lower demand
- Weaker relevance
- Competitor gains
- Technical failures
- SERP changes
- Tracking errors
- Seasonality
Mark uncertain explanations as hypotheses until supporting evidence exists.
14. Consolidate the Findings
Summarize the strongest evidence.
Each finding should identify:
- What changed
- Where it changed
- Evidence
- Relevant interpretation
- Further investigation required
Website SEO analytics becomes useful when connected metrics reveal meaningful patterns rather than functioning as isolated measurements.
What Insights Does SEO Analytics Provide?
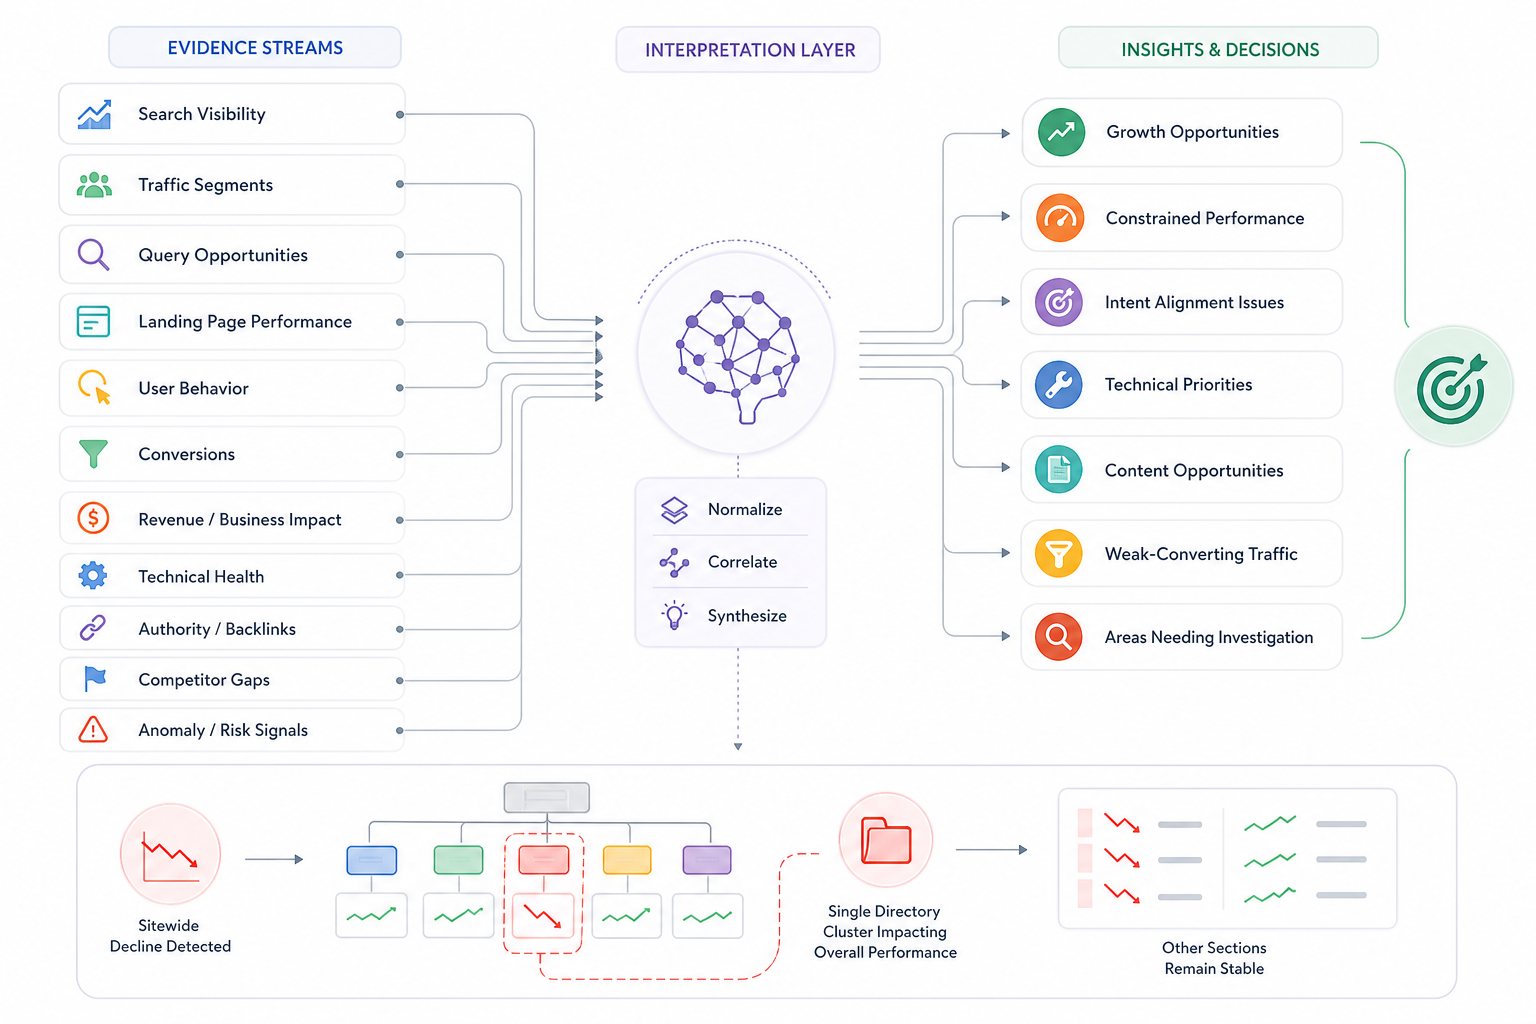
SEO analytics provides insight into how a website is discovered in search, which pages and queries drive performance, how organic visitors behave, and whether that visibility creates meaningful business outcomes.
An SEO insight is not simply another metric. It is an interpreted pattern in the evidence that helps explain performance or support a decision.
Reveal Search Visibility Trends
SEO analytics can show whether search exposure is increasing or declining.
Review patterns across:
- Impressions
- Clicks
- Ranking groups
- Search visibility
- Topics
This distinguishes broader search exposure from actual traffic growth.
Reveal Traffic Trends
Organic traffic can be segmented to identify where movement comes from.
Analyze:
- Pages
- Directories
- Devices
- Countries
- Content types
- Topics
A 10% sitewide decline can come almost entirely from one directory while the rest of the website remains stable.
Reveal Keyword and Query Opportunities
Query data can identify:
- Growing terms
- Declining terms
- High-impression queries
- Queries close to stronger ranking positions
- Searches generating clicks
- Weakly targeted demand
This helps identify where existing pages can deserve further analysis or improvement.
Reveal Landing-Page Performance
Analytics can identify which pages contribute most to:
- Growth
- Decline
- Traffic
- Visibility
- Conversions
This connects broad website performance with specific URLs.
Reveal Search-Intent Alignment
Compare:
- Queries
- Landing pages
- CTR
- Engagement
- Conversion behavior
This can indicate whether users reaching a page are aligned with the page’s intended purpose.
No single engagement metric proves intent satisfaction.
Reveal User-Behavior Patterns
Organic visitor data can show how users interact with:
- Landing pages
- Navigation
- Content
- Conversion paths
Use behavior metrics contextually rather than treating them as ranking signals.
Reveal Conversion Performance
SEO analytics identifies which:
- Queries
- Landing pages
- Topics
- Content groups
generate meaningful actions.
This helps separate traffic that creates business value from traffic that only increases visit counts.
Reveal Revenue and Business Impact
Where attribution systems allow, SEO analytics can connect organic acquisition with:
- Pipeline
- Sales
- Revenue
- Qualified leads
- Customer value
Avoid claiming exact SEO ROI when attribution is incomplete or heavily multi-touch.
Reveal Technical Problems
Technical analytics can expose conditions involving:
- Crawling
- Indexation
- Core Web Vitals
- Status codes
- Redirects
- Rendering
Prioritize technical problems that correspond with meaningful search or page-level issues.
Reveal Authority Changes
Backlink analytics can show whether priority pages or website sections are gaining or losing relevant external support.
Review:
- Referring domains
- New links
- Lost links
- Competitor gaps
Reveal Competitor Gaps
Competitive data can identify areas where other websites possess stronger:
- Keyword visibility
- Content coverage
- Backlinks
- Search presence
Use this information to identify opportunities rather than reproduce competitors mechanically.
Reveal Emerging Risks
Analytics can expose unusual movements in:
- Visibility
- Traffic
- Conversions
- Indexation
- Technical performance
- Rankings
An anomaly signals a need for investigation rather than proving a cause.
Reveal Growth Opportunities
Common opportunities include:
- High-impression queries with weak clicks
- Pages approaching stronger ranking ranges
- Content gaps
- Pages losing performance
- Internal-link opportunities
- Strong-traffic pages with weak conversions
The value of SEO insights comes from identifying where performance is improving, where it is constrained, and what deserves further attention.
How Do You Create SEO Analytics Reports?
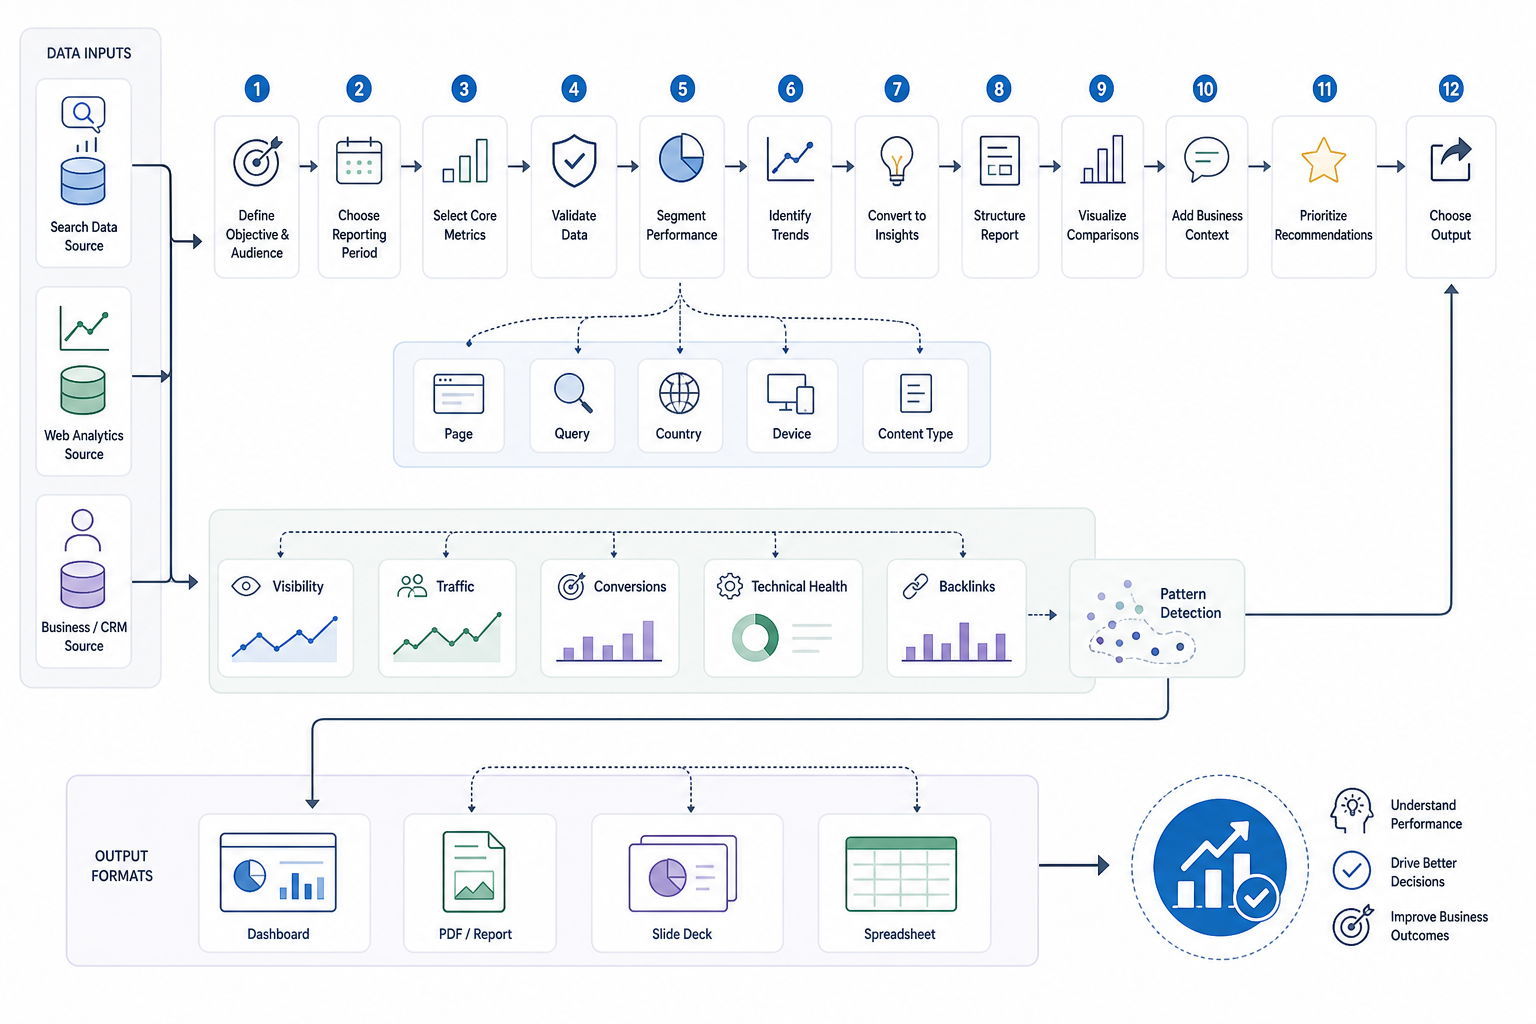
An SEO analytics report is created by connecting reliable search, website, and business data, selecting metrics that match the reporting objective, interpreting performance patterns, and presenting the findings in a clear structure. This reporting process sits within broader SEO reporting, where performance data, findings, trends, and actions are organized for recurring communication and decision-making.
1. Define the Reporting Objective
Establish whether the report measures:
- Overall SEO performance
- Search visibility
- Organic traffic
- Conversions
- Content performance
- Technical health
- Another defined objective
Identify the audience.
Executives, SEO teams, marketing teams, and clients require different levels of detail.
2. Select the Reporting Period
Choose a consistent period and comparison.
Examples include:
- Month over month
- Quarter over quarter
- Year over year
- Pre/post implementation
Account for seasonality where relevant.
3. Connect First-Party Data Sources
Use Search Console for:
- Queries
- Impressions
- Clicks
- CTR
- Position
- Indexing-related evidence
Use analytics for:
- Organic traffic
- Landing pages
- Engagement
- Conversions
Add CRM or revenue data where business impact needs to be measured.
4. Add Supporting SEO Data
Integrate supporting platforms when the report requires:
- Rankings
- Backlinks
- Crawl data
- Competitor data
- Technical evidence
Keep measured and estimated metrics clearly differentiated.
5. Select the Core Metrics
Choose KPIs according to the objective.
A balanced report can include:
- Visibility indicators
- Acquisition metrics
- Outcome metrics
Technical and backlink information belongs in the report when it helps explain performance.
6. Validate the Data
Check:
- Date ranges
- Filters
- Channel definitions
- Conversion events
- Connector status
- Tracking changes
- Metric definitions
Automated dashboards can contain incorrect data when underlying configuration changes.
7. Segment Website Performance
Break aggregate data down by:
- Landing page
- Query
- Directory
- Topic
- Country
- Device
- Content type
Segmentation helps identify the actual source of changes.
8. Identify Trends and Patterns
Compare related metrics.
Look for meaningful changes across:
- Visibility
- Traffic
- Rankings
- Engagement
- Conversions
- Technical performance
- Backlinks
9. Convert Patterns Into Insights
Explain what the observed evidence indicates.
Distinguish between:
- Confirmed evidence
- Reasonable interpretation
- Hypotheses requiring validation
10. Build the Report Structure
Start with an executive summary.
Then include the relevant:
- KPIs
- Visibility trends
- Traffic performance
- Landing-page findings
- Keyword findings
- Technical or backlink context
- Business outcomes
- Recommendations
11. Visualize Meaningful Comparisons
Use charts when they make a pattern easier to understand.
Useful chart topics include:
- Traffic trends
- Visibility trends
- Conversion changes
- Landing-page contribution
- Period comparisons
Use tables for structured comparisons across several pages, keywords, or metrics.
12. Add Business Context
Connect SEO metrics with:
- Leads
- Purchases
- Revenue
- Pipeline
- Sign-ups
- Other business goals
Keep supporting SEO indicators separate from business outcomes.
13. Include AI-Search Visibility Where Relevant
If AI-search visibility is part of the measurement framework, document:
- Platform
- Query set
- Mention or citation methodology
- Limitations
Do not merge AI mentions with traditional rankings, impressions, clicks, or conversions into one generic metric.
14. Add Prioritized Recommendations
Turn important findings into specific actions.
Possible recommendations include:
- Improve
- Fix
- Expand
- Consolidate
- Investigate
- Monitor
Tie each recommendation to its supporting evidence.
15. Choose the Reporting Output
Use:
- Dashboards for recurring monitoring
- PDFs for fixed reports
- Slide decks for stakeholder reviews
- Spreadsheets for detailed operational data
Combine formats where necessary.
16. Review the Final Report
Confirm that:
- Important metrics have context.
- Charts answer clear questions.
- Recommendations connect with findings.
- Data remains consistent.
- Unnecessary technical detail has been removed.
SEO analytics and reporting become useful when measured search performance turns into understandable insights and practical decisions.
How Does SEO Analytics Support Marketing and SEO Management?
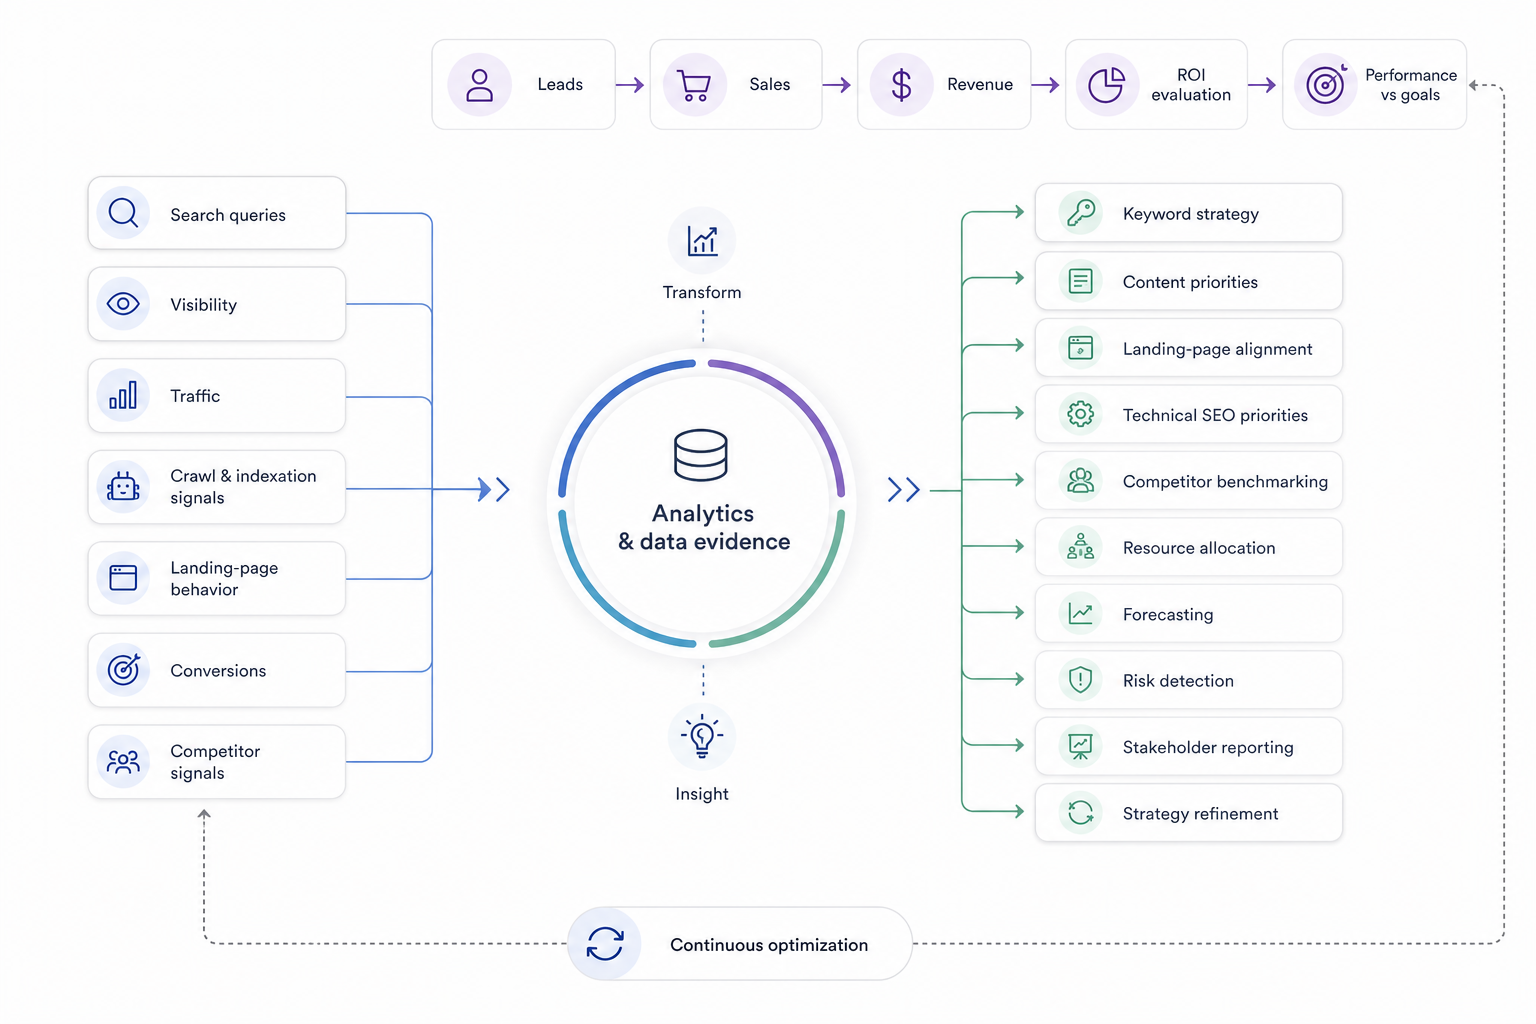
SEO analytics supports marketing and SEO management by turning search-performance data into evidence for strategy, prioritization, resource allocation, and business-performance evaluation. In SEO marketing, that evidence helps connect organic-search performance with audience demand, acquisition goals, website activity, and wider marketing decisions.
Analytics does not manage SEO by itself. It provides the evidence managers use to decide what deserves attention.
Measure Organic-Search Contribution
Connect organic visibility with:
- Traffic
- Leads
- Sales
- Revenue
- Other business outcomes
This helps determine whether SEO contributes to the objectives the strategy was designed to support.
Evaluate SEO Performance Against Goals
Compare results with:
- Targets
- Historical baselines
- Forecasts
- Previous periods
This helps distinguish meaningful progress from short-term fluctuations.
Understand Search Demand
Use query and visibility data to understand:
- What audiences search for
- Which topics are growing
- Where demand is declining
- Which language users prefer
Search behavior can support wider market and audience understanding.
Refine Keyword Strategy
Identify:
- Queries generating clicks
- Queries producing conversions
- High-impression terms
- Weakly aligned terms
- Growing search opportunities
Use real performance evidence alongside estimated keyword demand.
Guide Content Strategy
Analytics can reveal:
- High-performing topics
- Declining pages
- Successful content formats
- Strong content clusters
- Missing search opportunities
Use this evidence to prioritize:
- Updates
- Expansion
- Consolidation
- New content
Improve Landing-Page Alignment
Compare queries with:
- Landing pages
- Engagement
- Conversions
This helps determine whether the right searchers reach the right pages.
Prioritize Technical SEO Work
Use:
- Crawl data
- Indexation evidence
- Performance information
- Page-level results
to identify technical problems affecting strategically important pages.
This helps separate critical blockers from low-impact cleanup.
Benchmark Competitors
Compare relevant competitors across:
- Search visibility
- Keywords
- Content
- Backlinks
- Search presence
Use competitor analytics to identify gaps and opportunities.
Measure Conversion and Revenue Impact
Where attribution permits, connect SEO with:
- Leads
- Purchases
- Pipeline
- Revenue
- Customer acquisition
This helps identify which organic-search areas generate the most business value.
Support ROI Evaluation
Compare SEO investment with attributable or reasonably connected business outcomes where reliable cost and revenue information exists.
Avoid presenting precise ROI when attribution is incomplete.
Guide Resource Allocation
Use performance evidence to decide where resources belong.
Possible areas include:
- Content
- Technical SEO
- Development
- Link acquisition
- Page optimization
Higher-value opportunities deserve greater resources than low-impact tasks.
Support Forecasting and Planning
Historical performance can support estimates involving:
- Traffic potential
- Seasonal demand
- Content growth
- Ranking opportunities
- Conversion expectations
Forecasts remain estimates rather than guaranteed outcomes.
Identify Risks Early
SEO analytics can expose unexpected changes in:
- Traffic
- Visibility
- Conversions
- Indexation
- Technical health
This allows faster investigation.
Improve Stakeholder Communication
Analytics provides the evidence used in dashboards and SEO reports.
Marketing leaders can understand:
- Performance
- Business contribution
- Risks
- Opportunities
- Priorities
without reviewing raw SEO datasets themselves.
Support Continuous Strategy Refinement
New data can challenge previous assumptions.
A keyword that appeared attractive during research can generate weak business results. A low-volume page can become a strong lead generator. A technically healthy directory can still lose visibility because competitors improve faster.
SEO analytics gives marketing and SEO managers the evidence required to reassess priorities, allocate resources, evaluate outcomes, and refine the strategy as conditions change.
Need links on real SaaS and business websites?
Links are placed after your approval, on sites with guaranteed DR and traffic, with a 1-year replacement guarantee.

